Er diagram
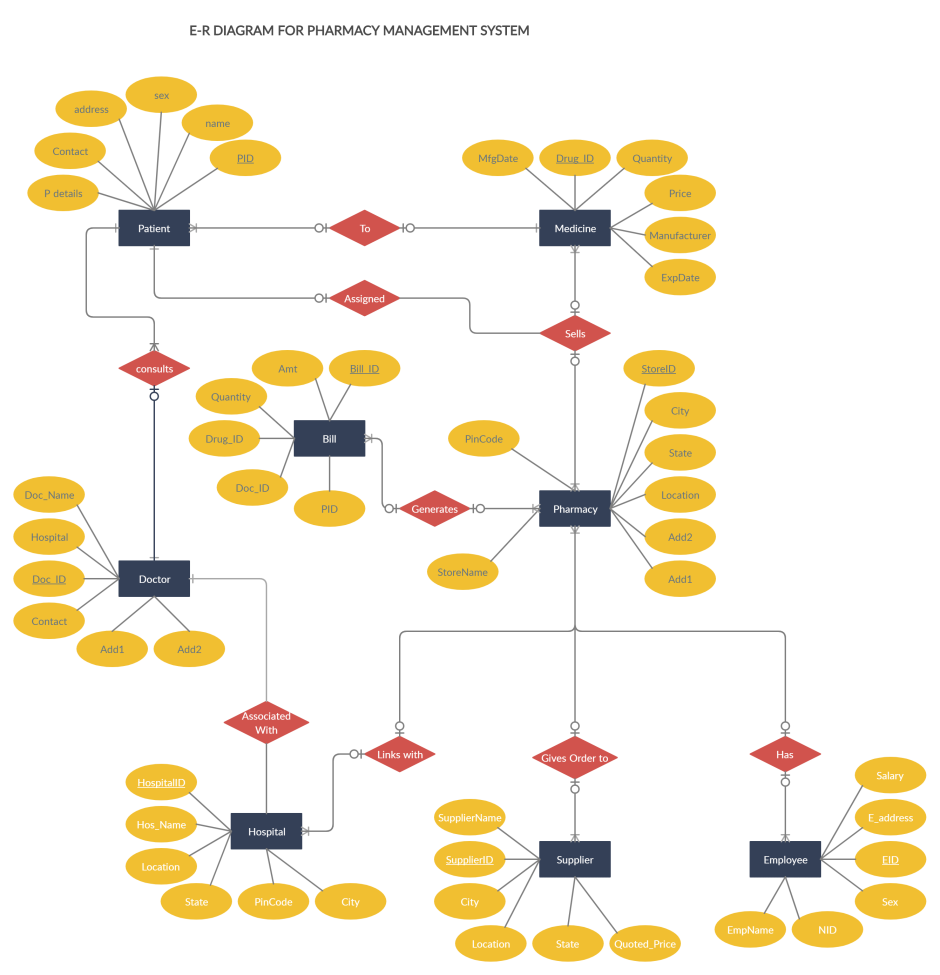
An ER diagram, also known as an Entity-Relationship diagram, is a visual representation of the relationships between entities in a database. It is a powerful tool used by developers and designers to map out the structure and connections of a database system.
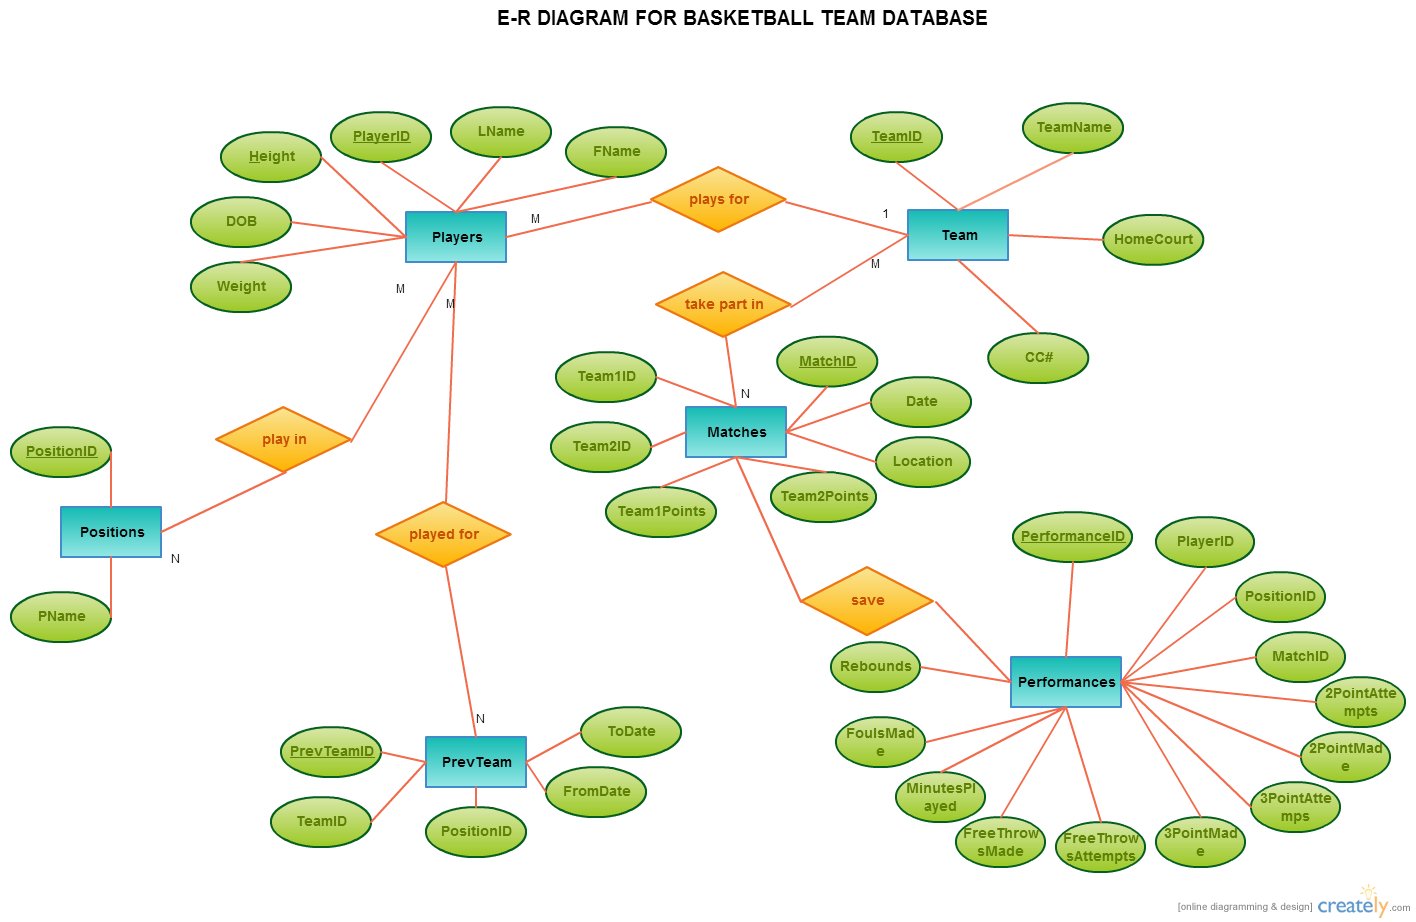
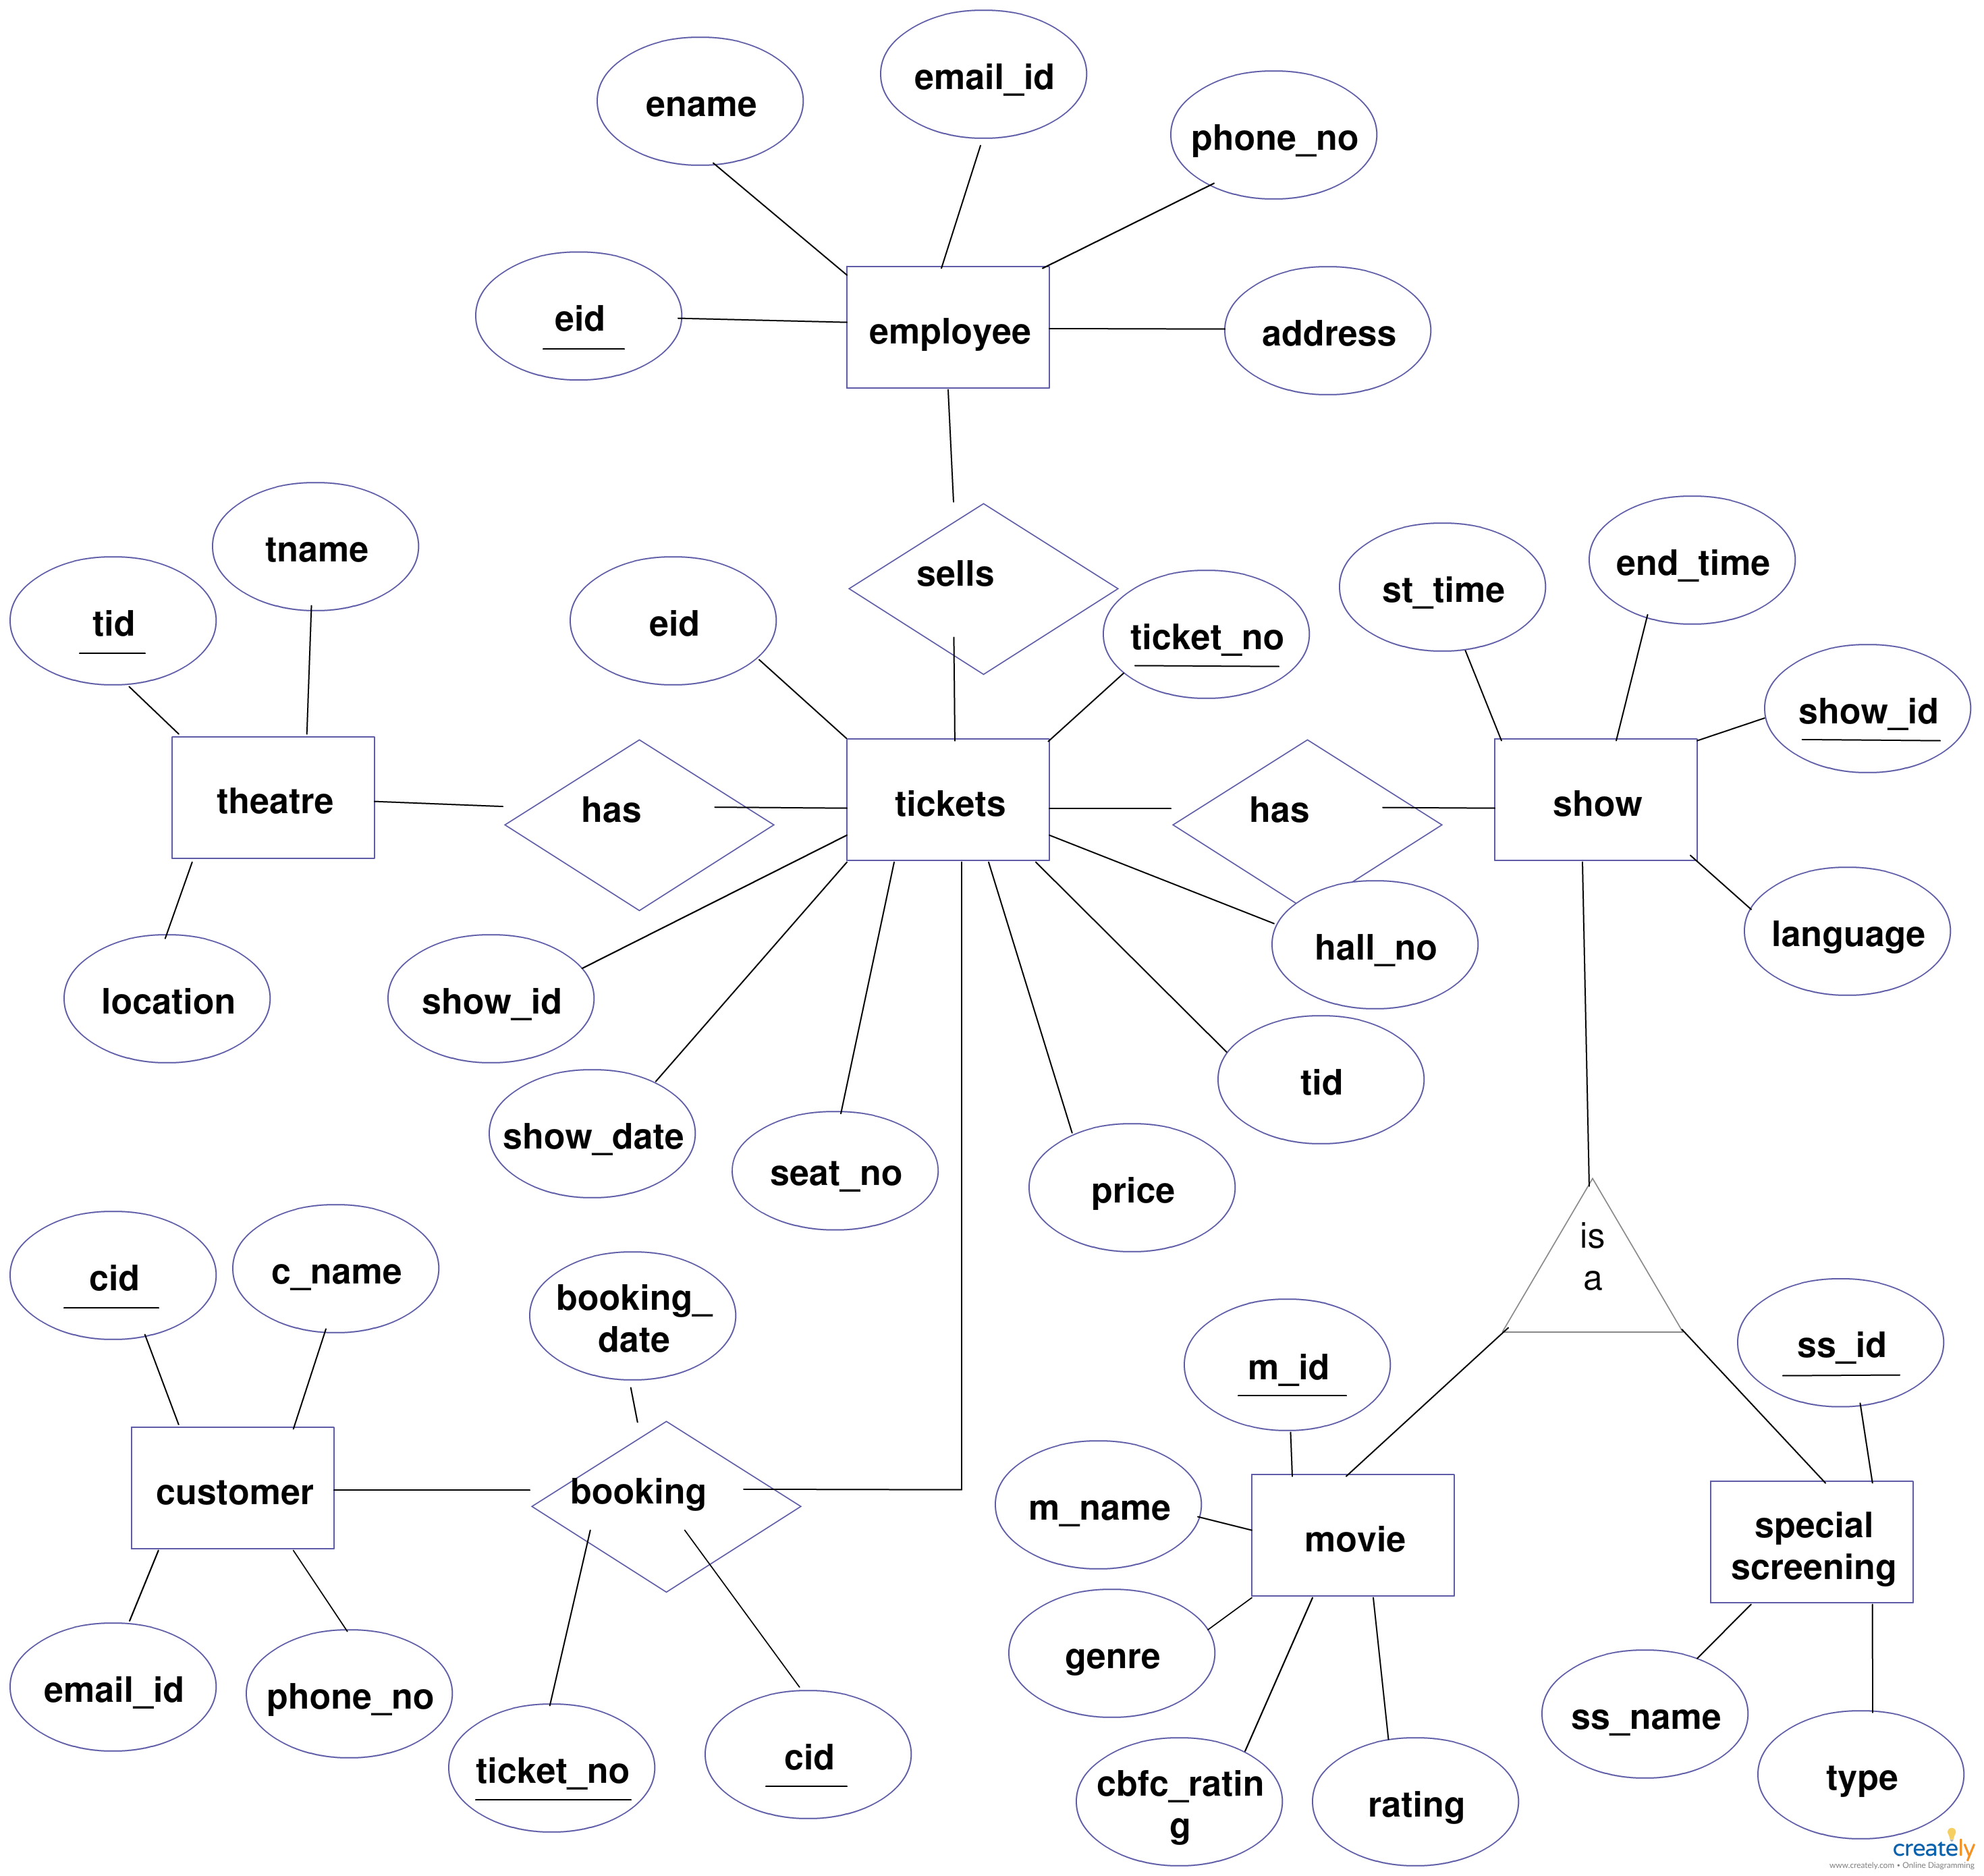
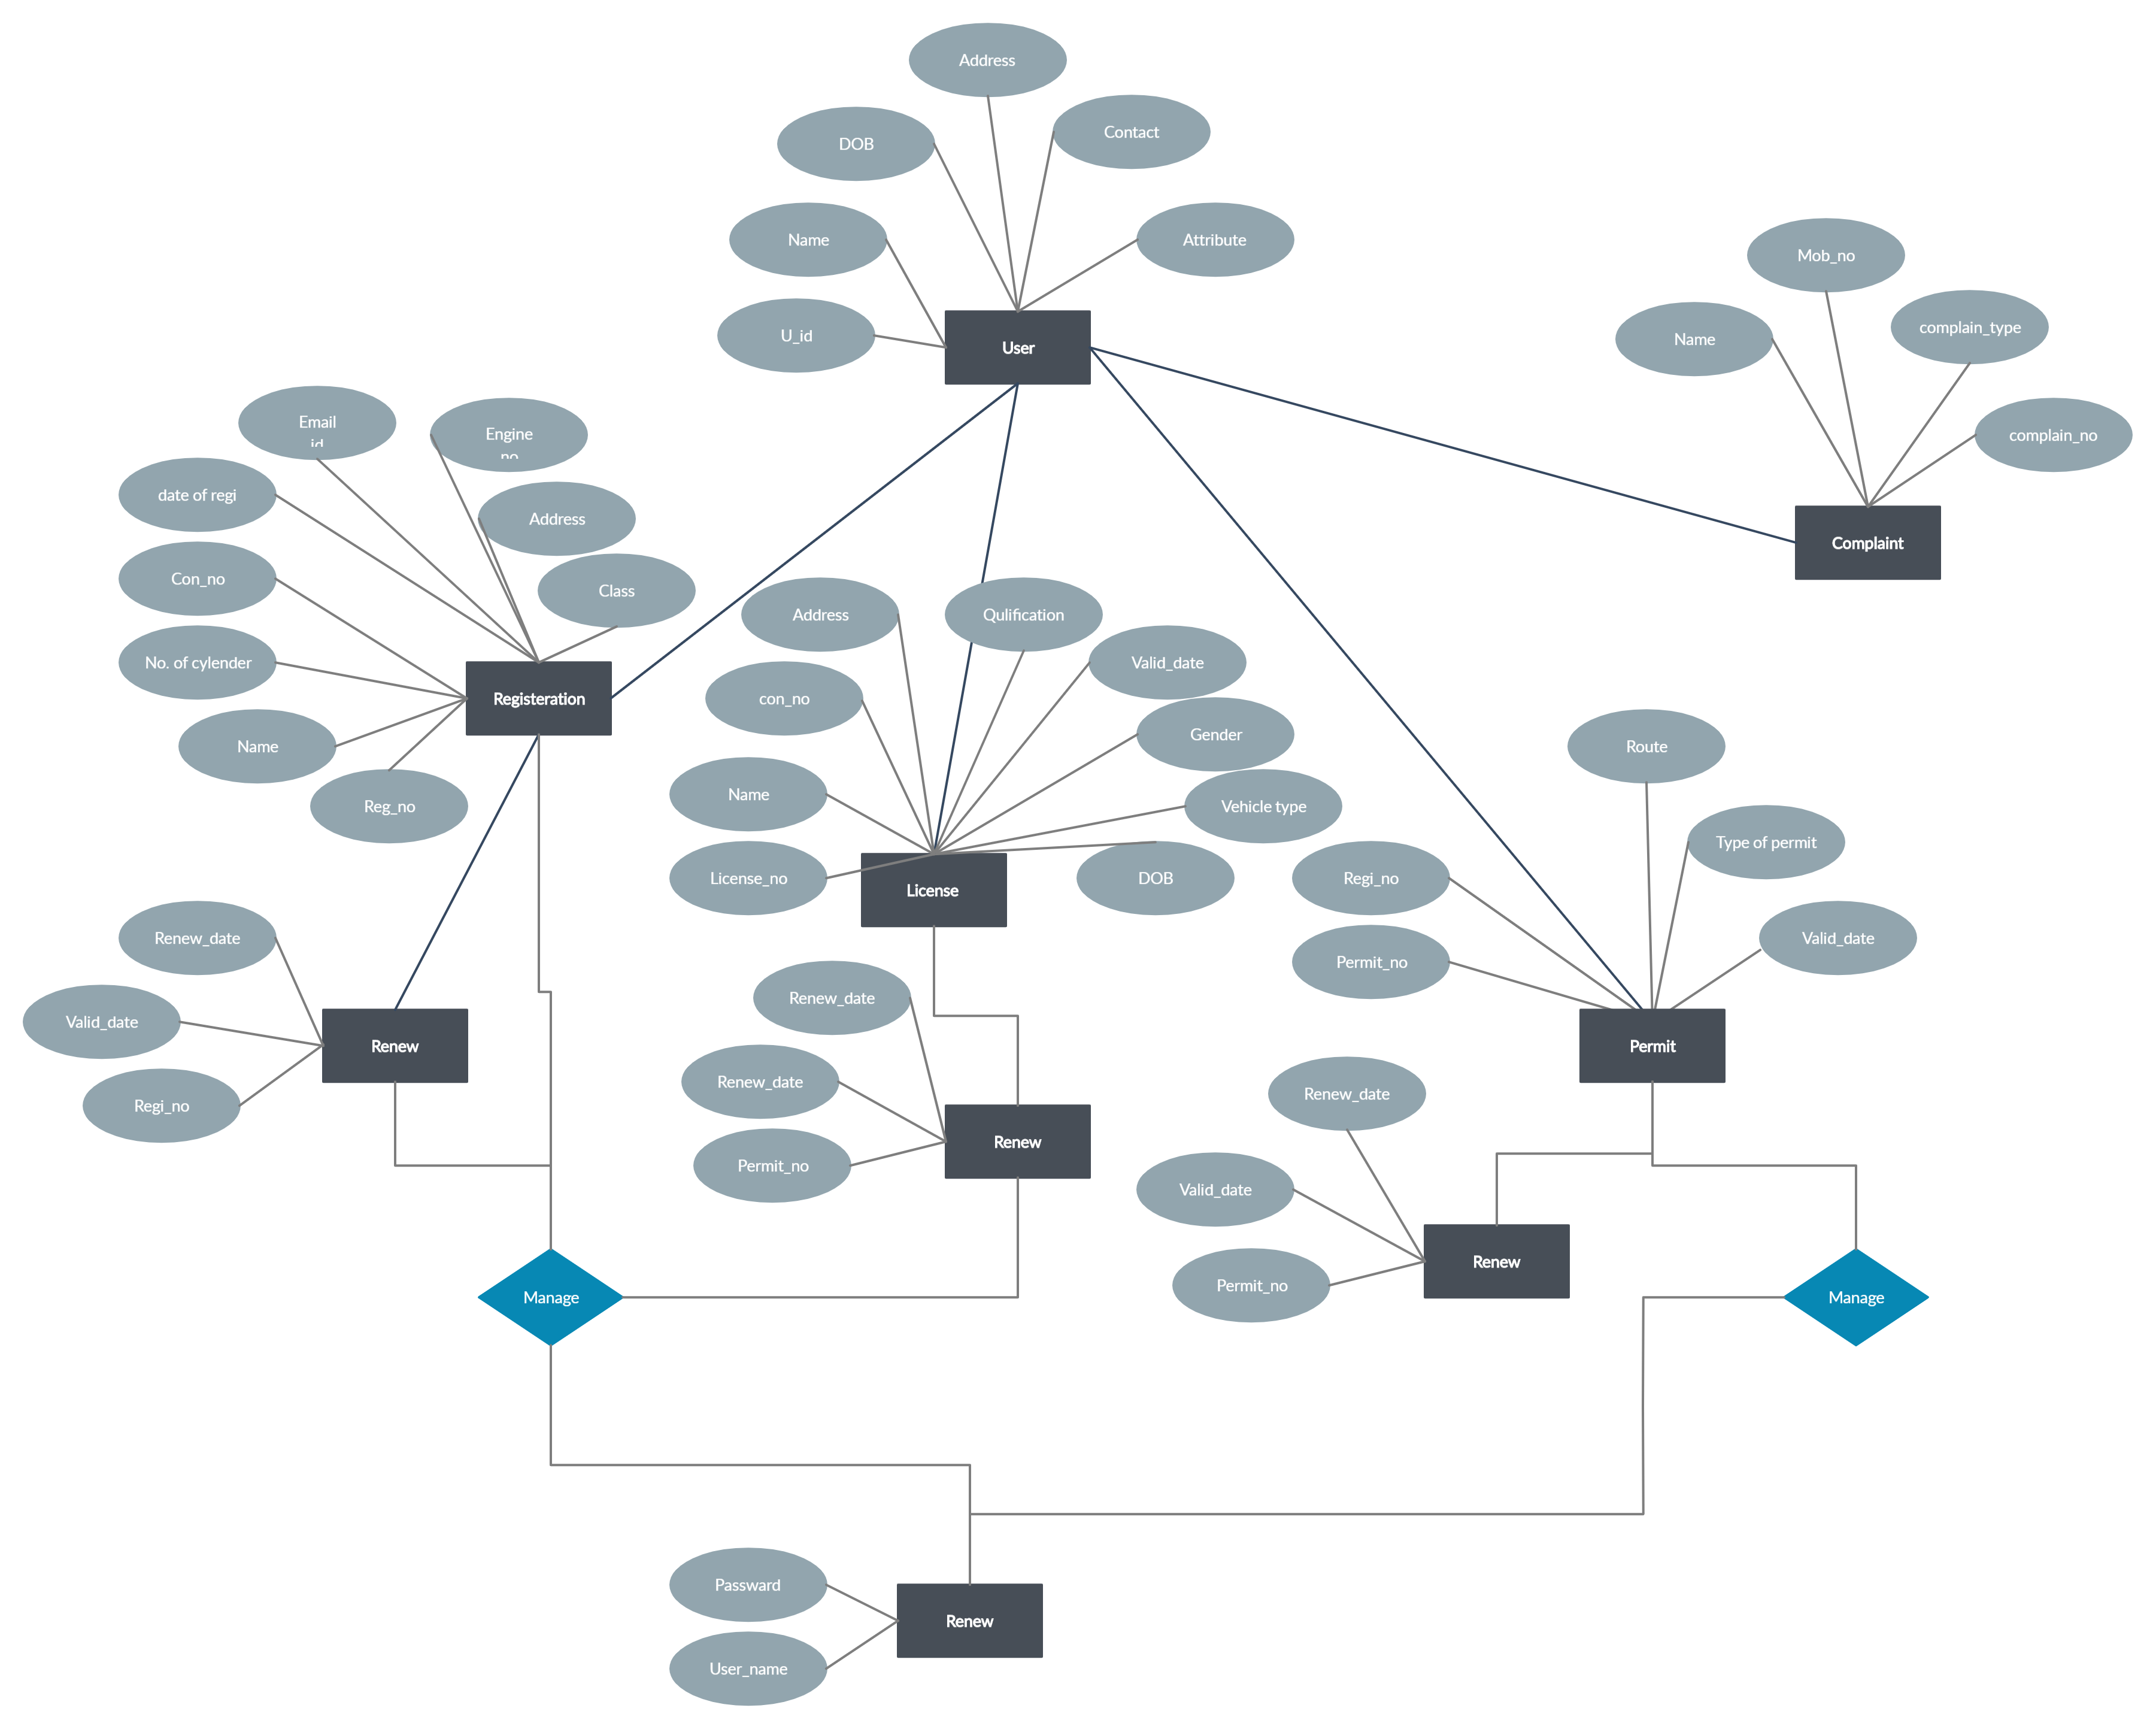
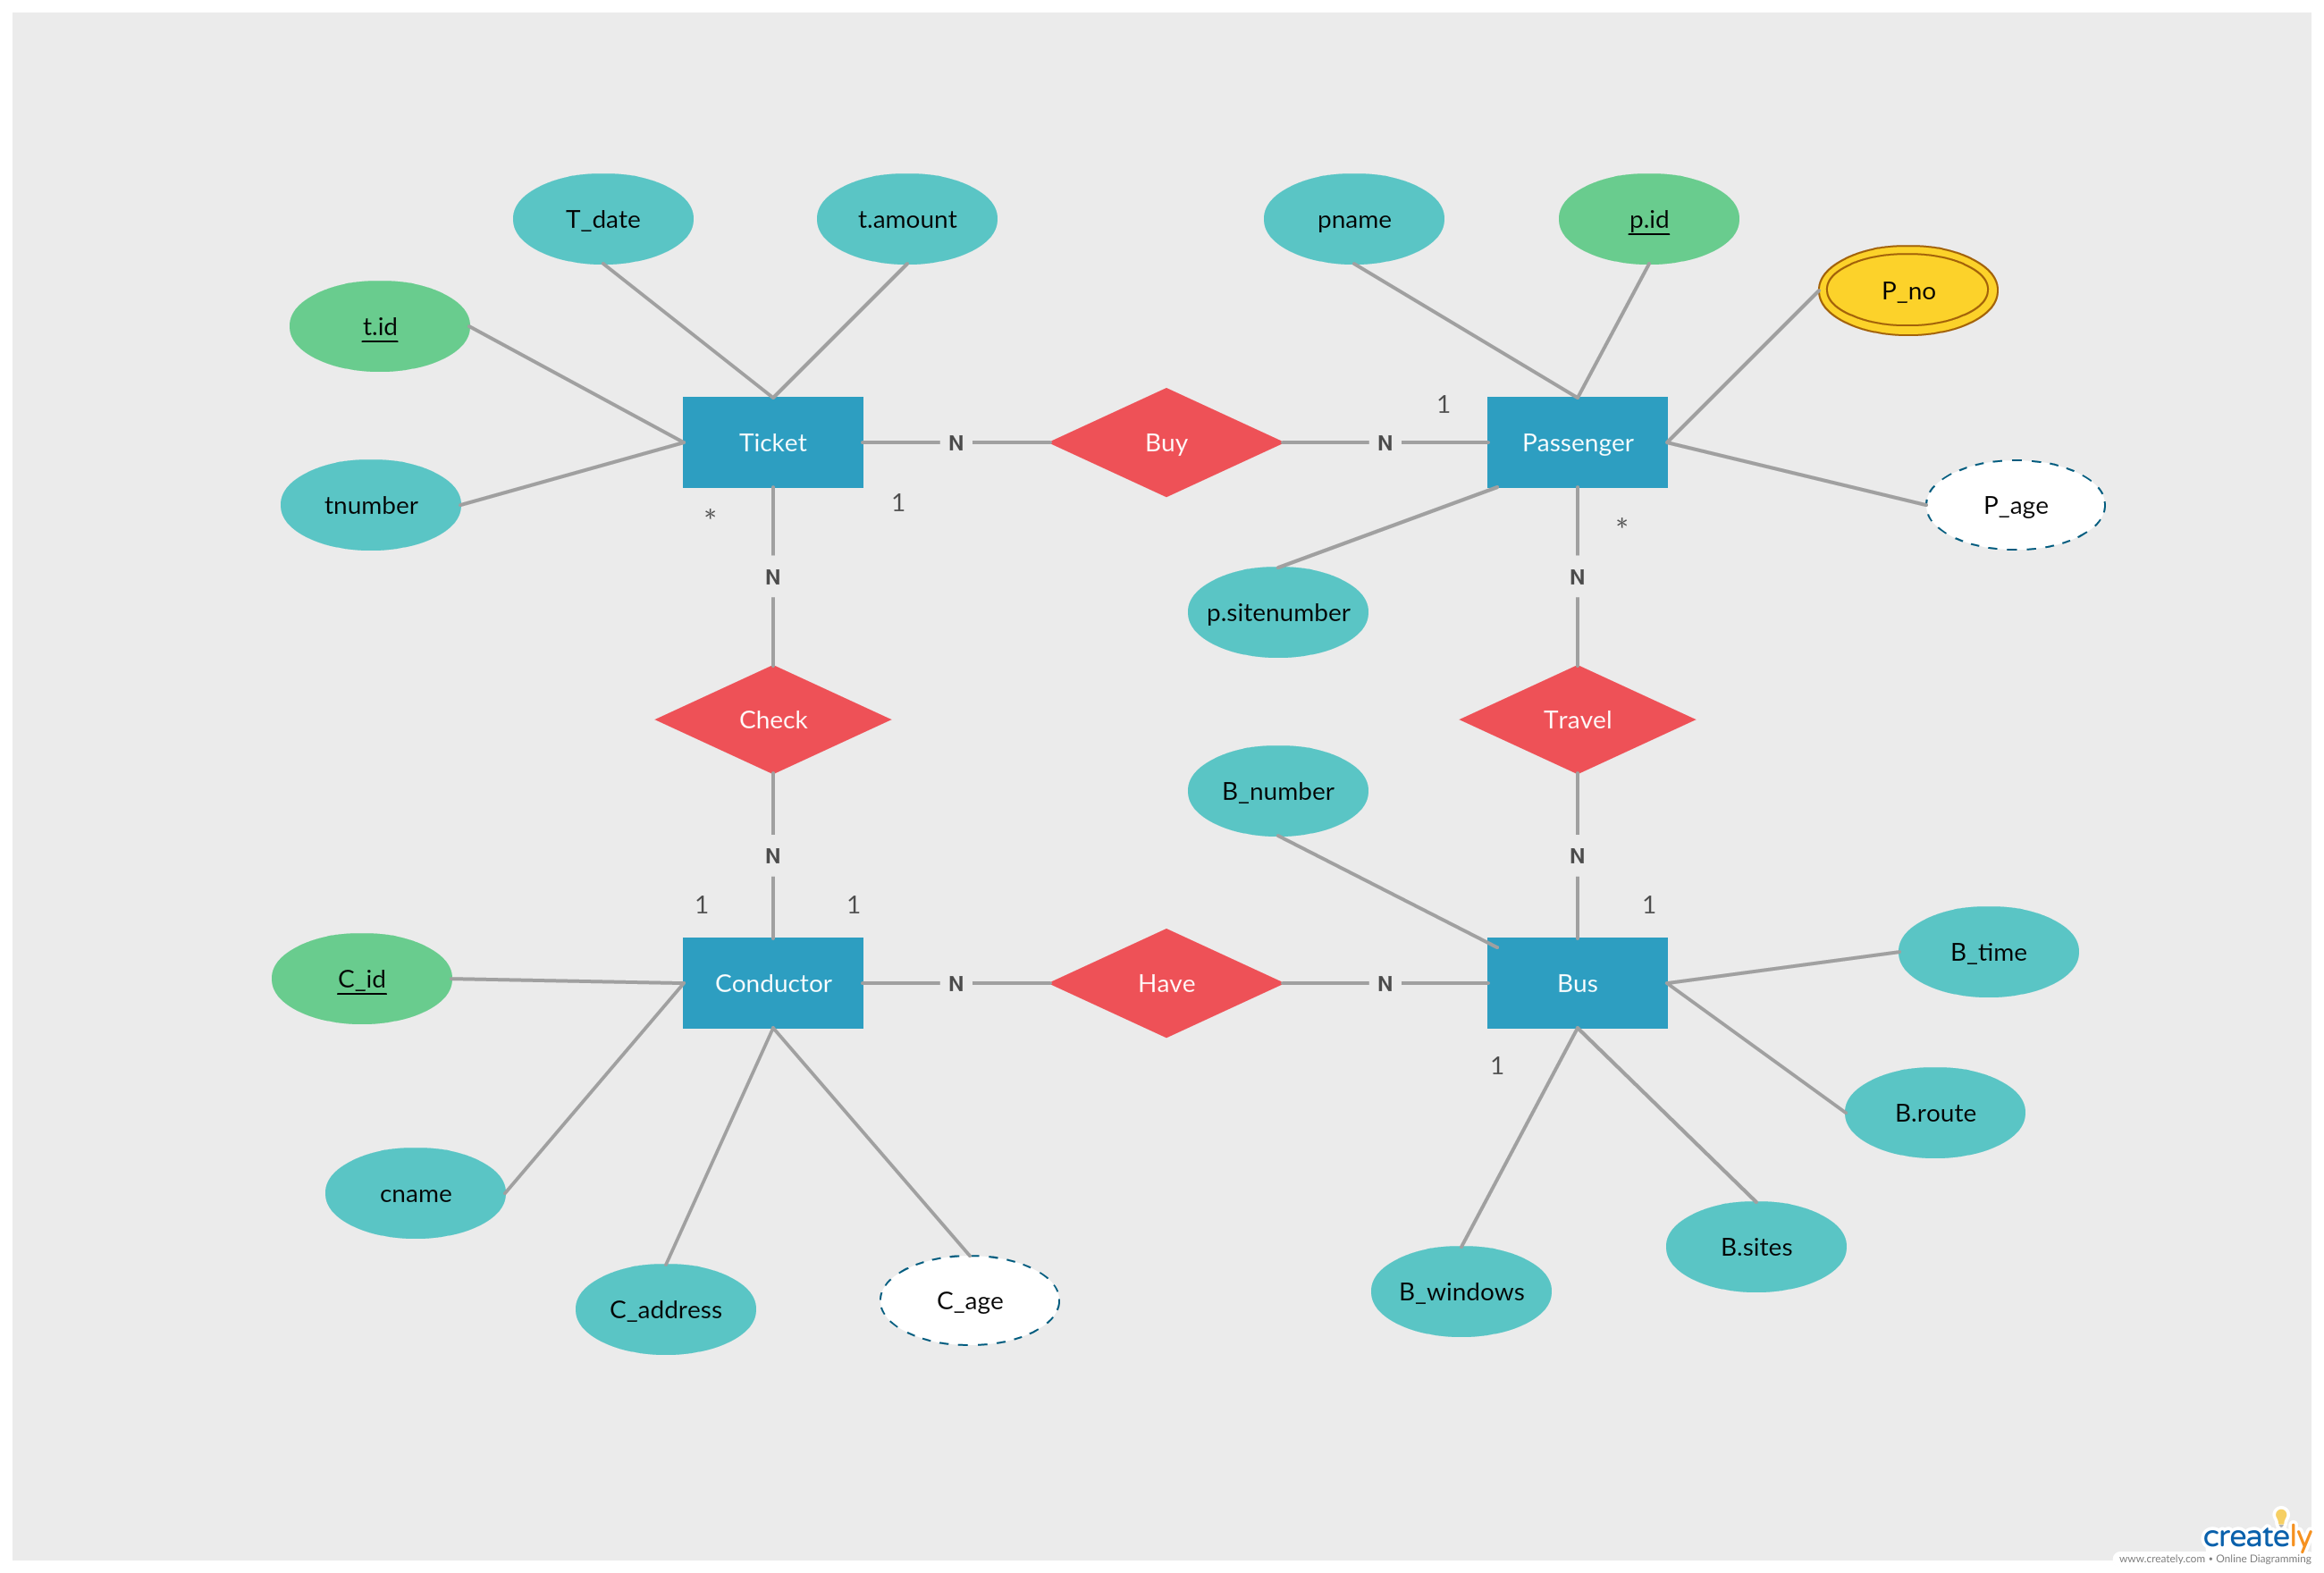
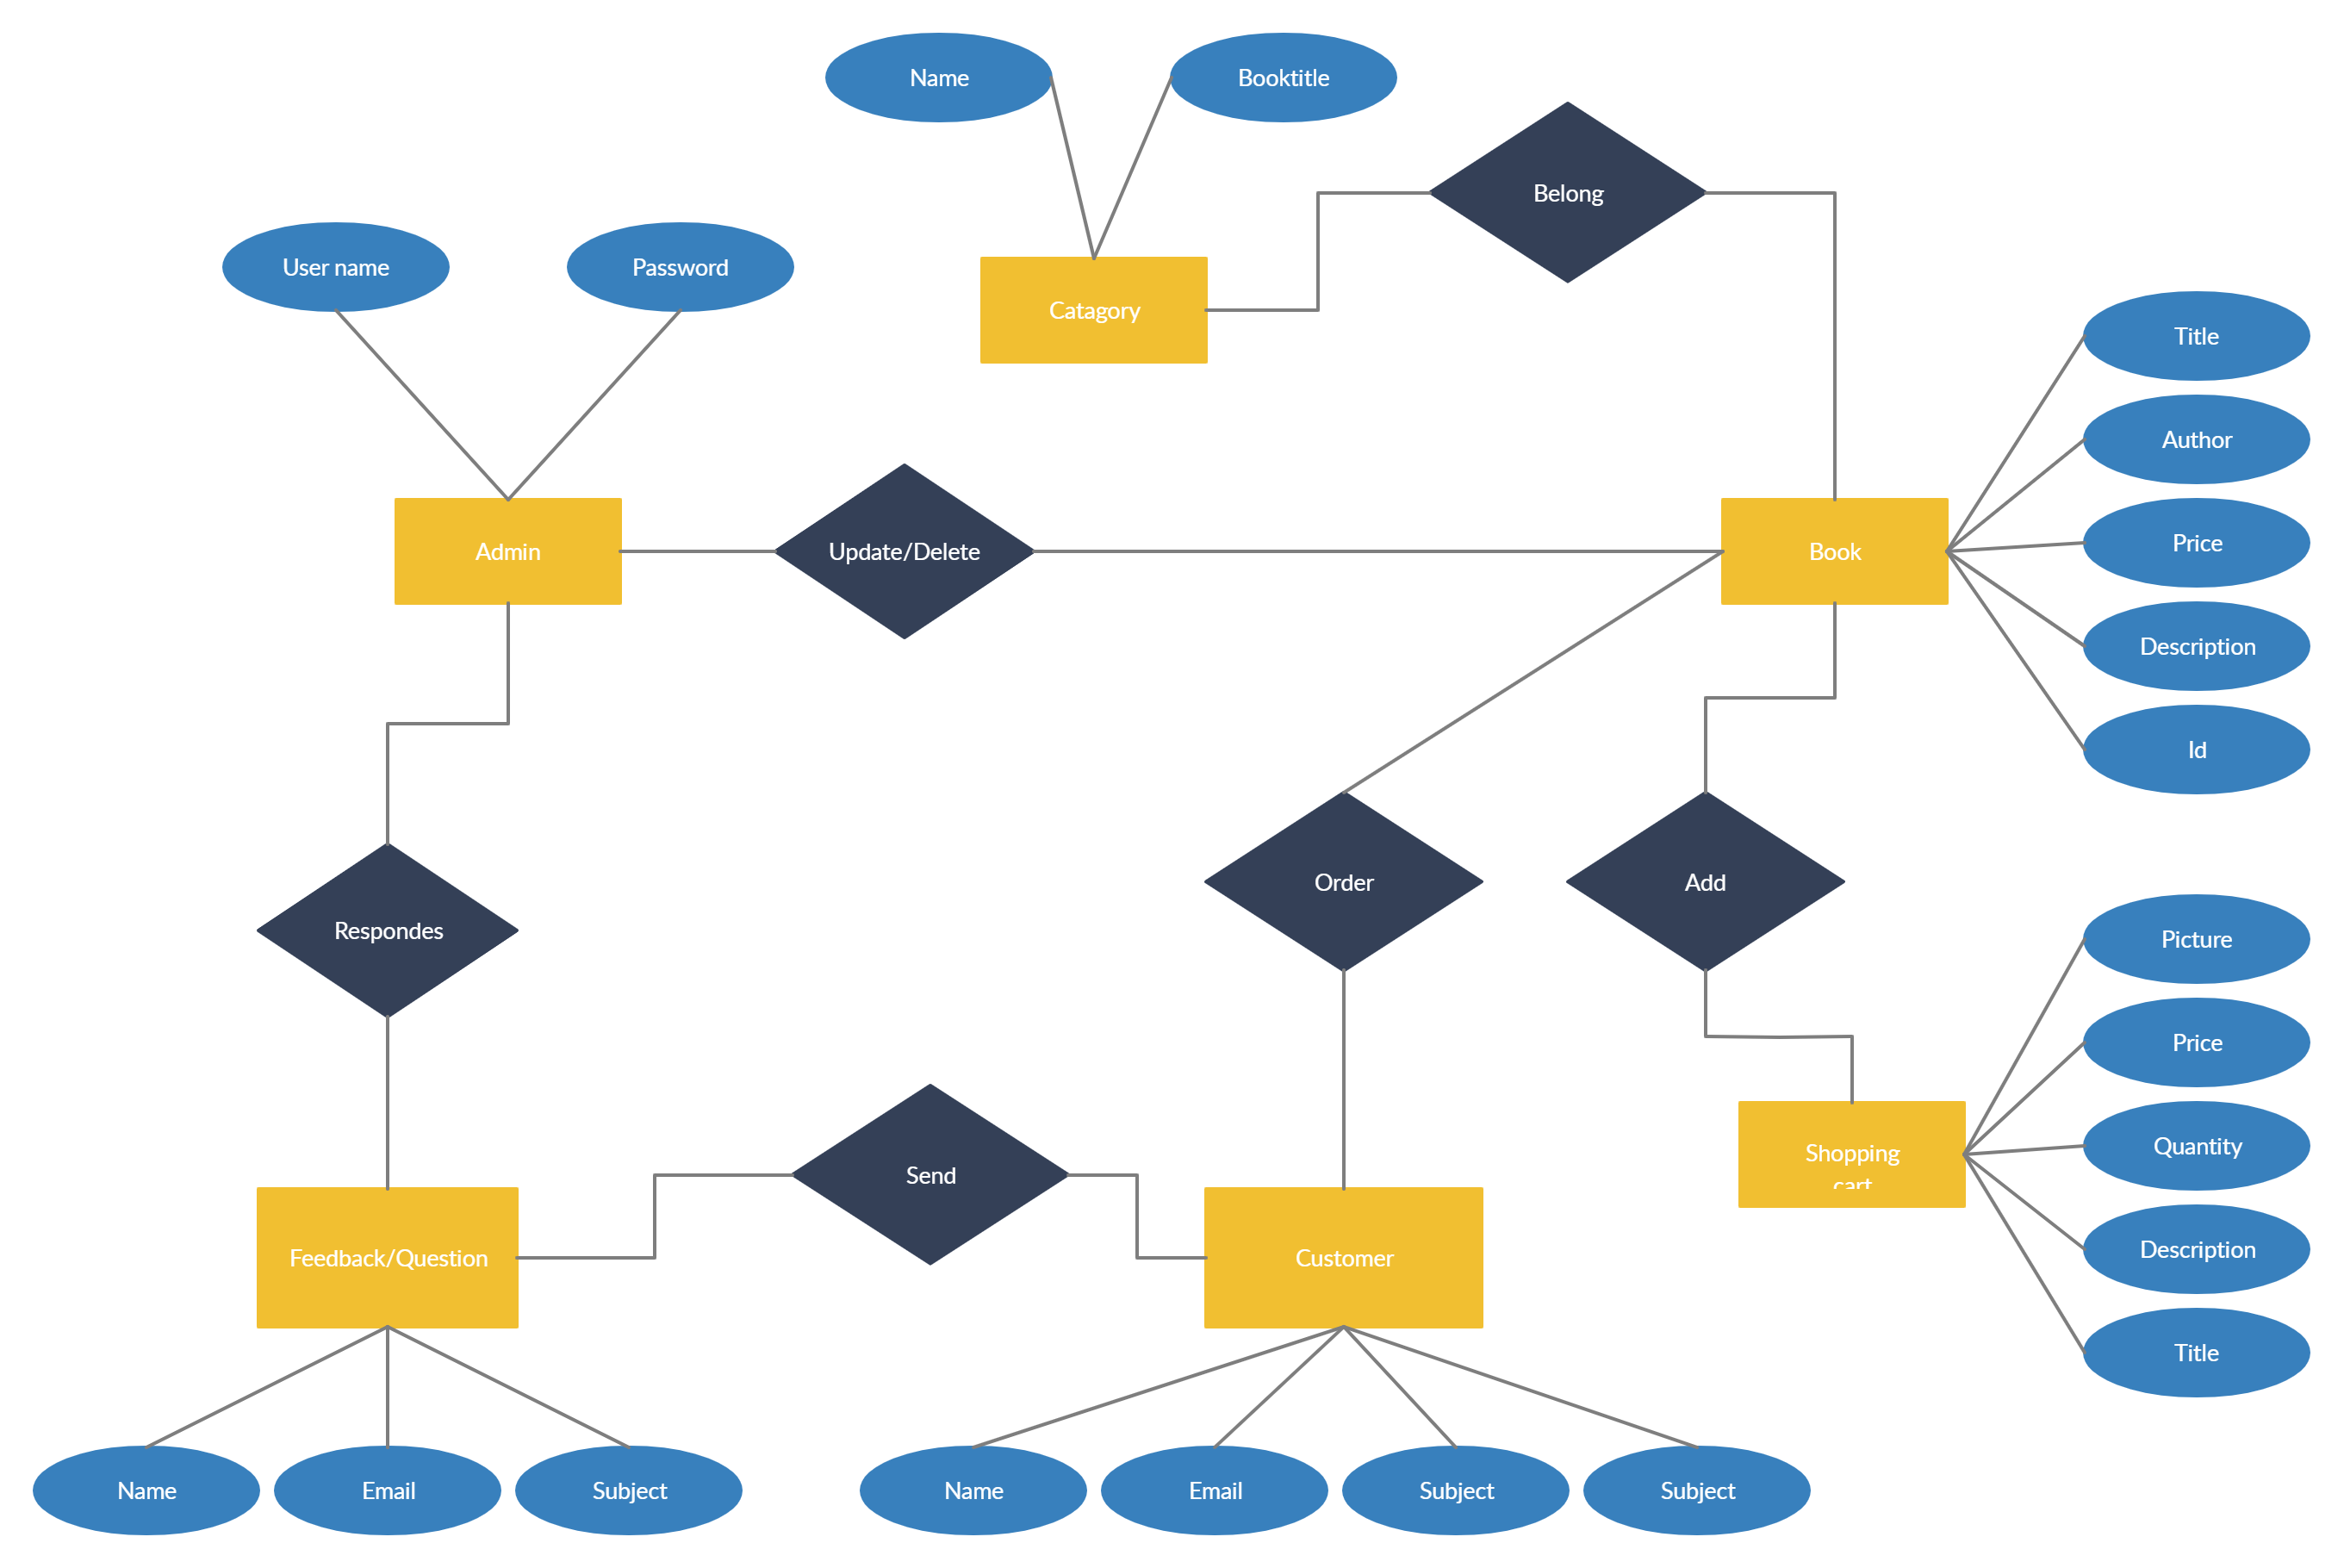
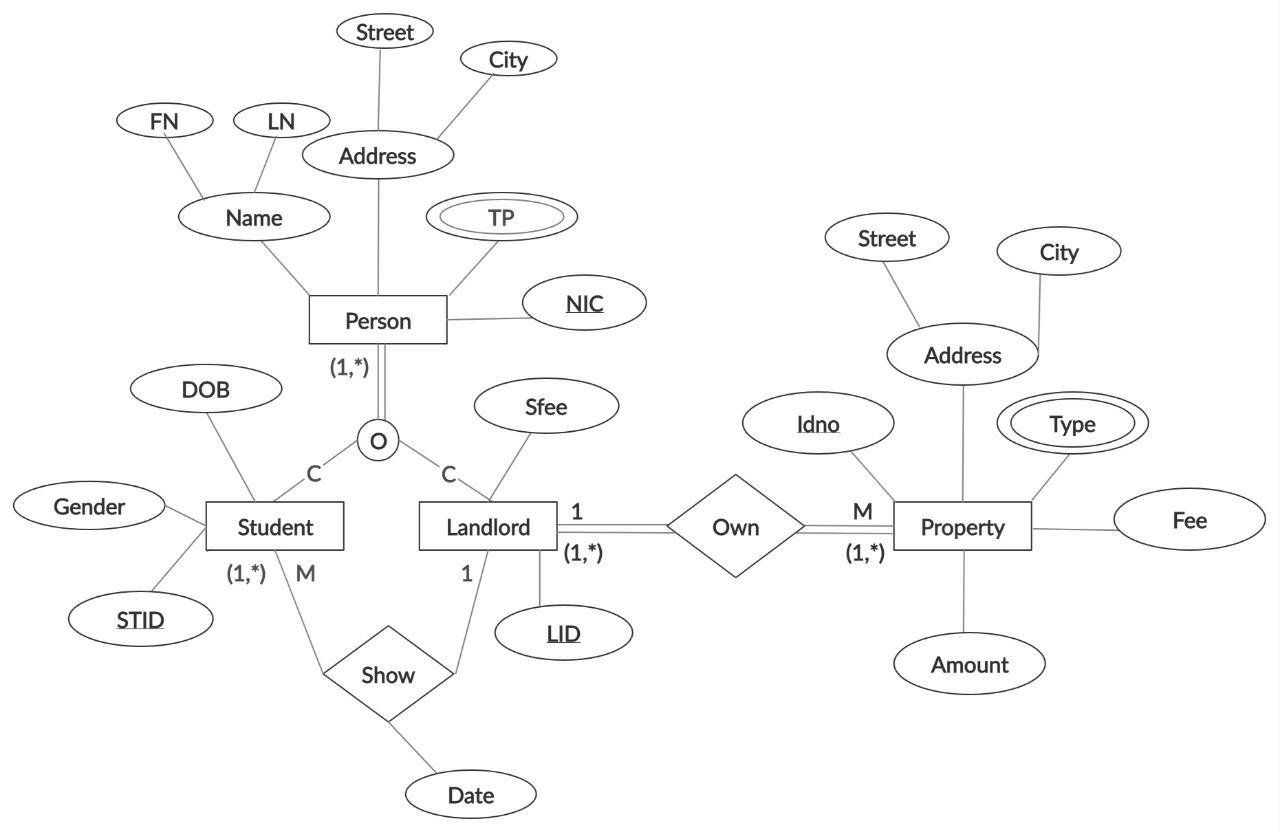
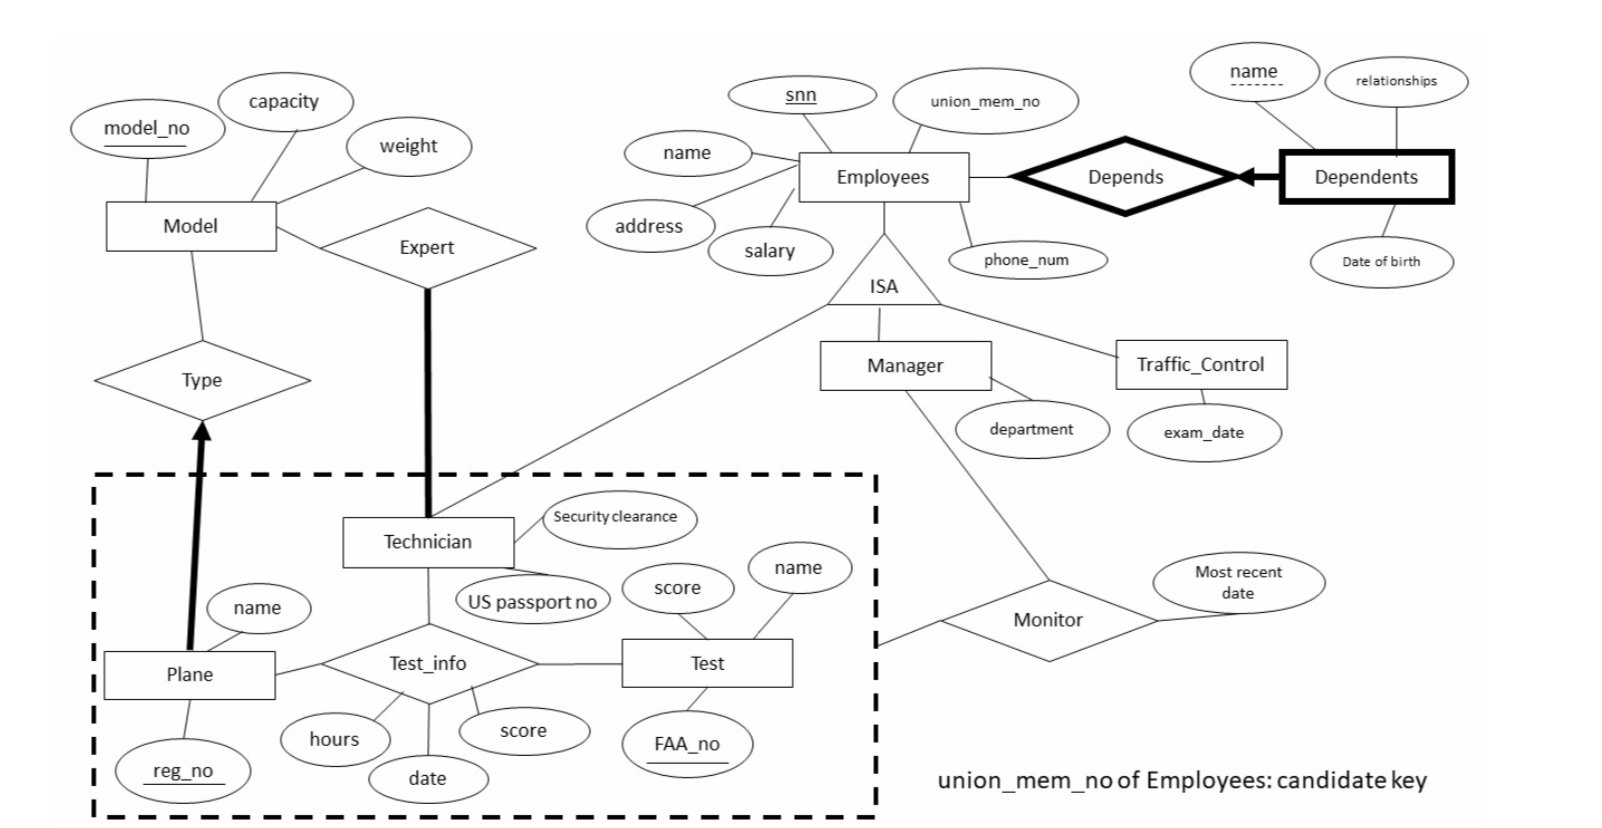
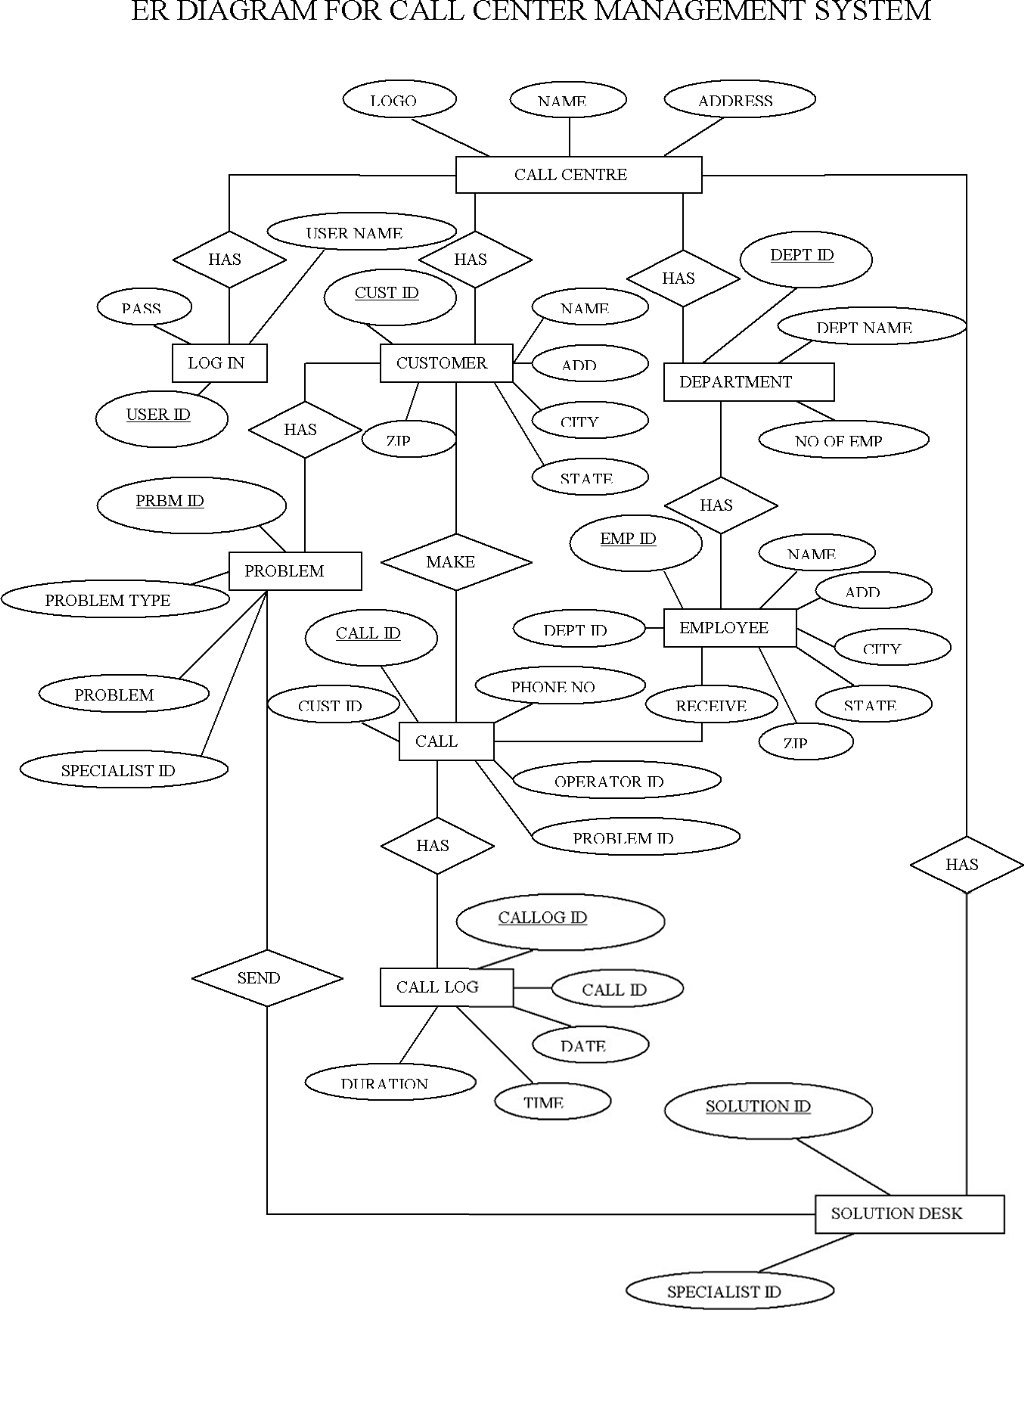
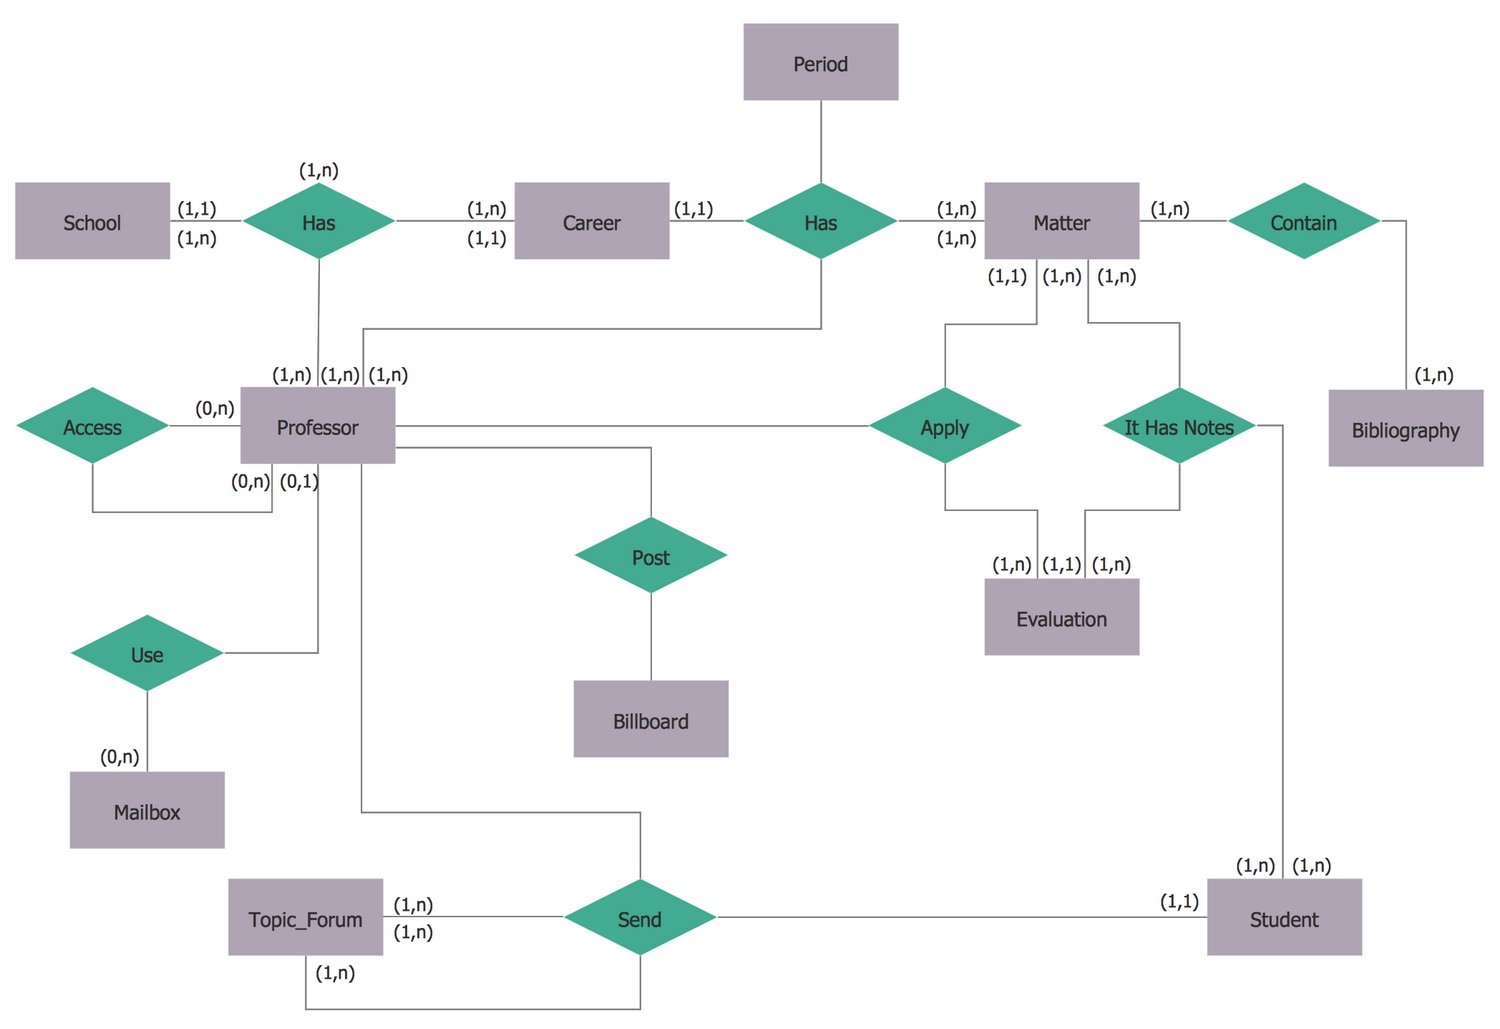
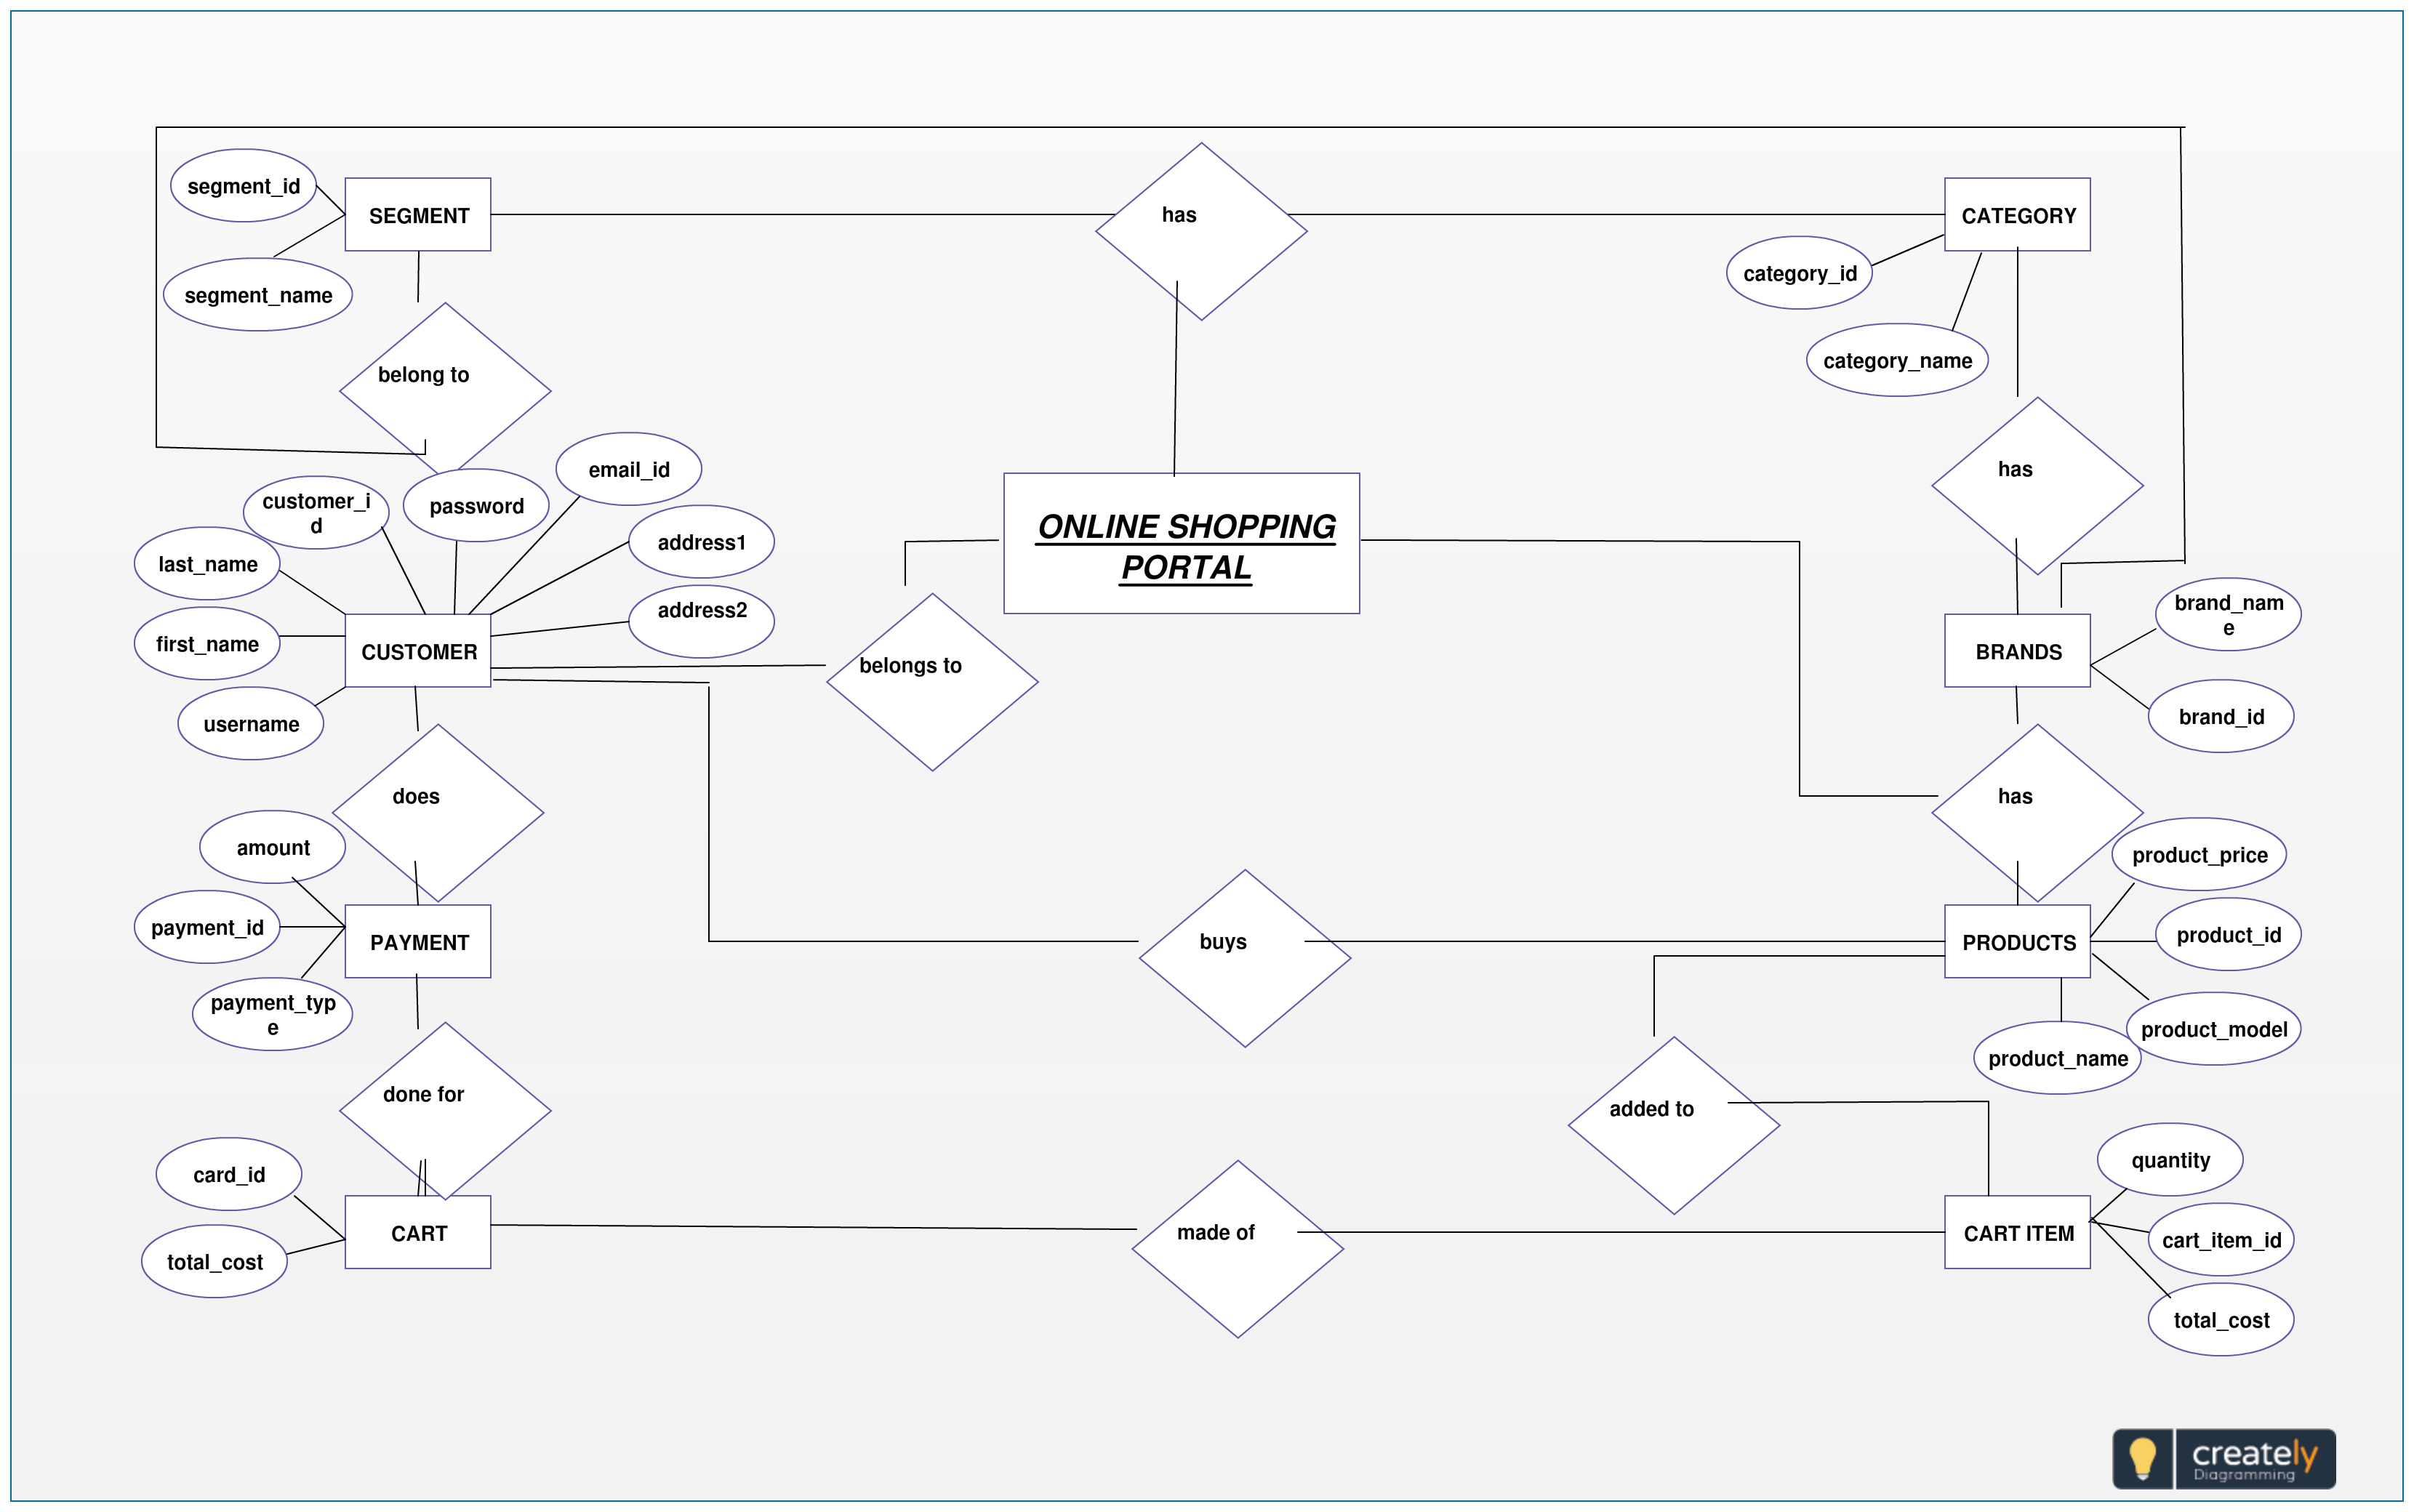
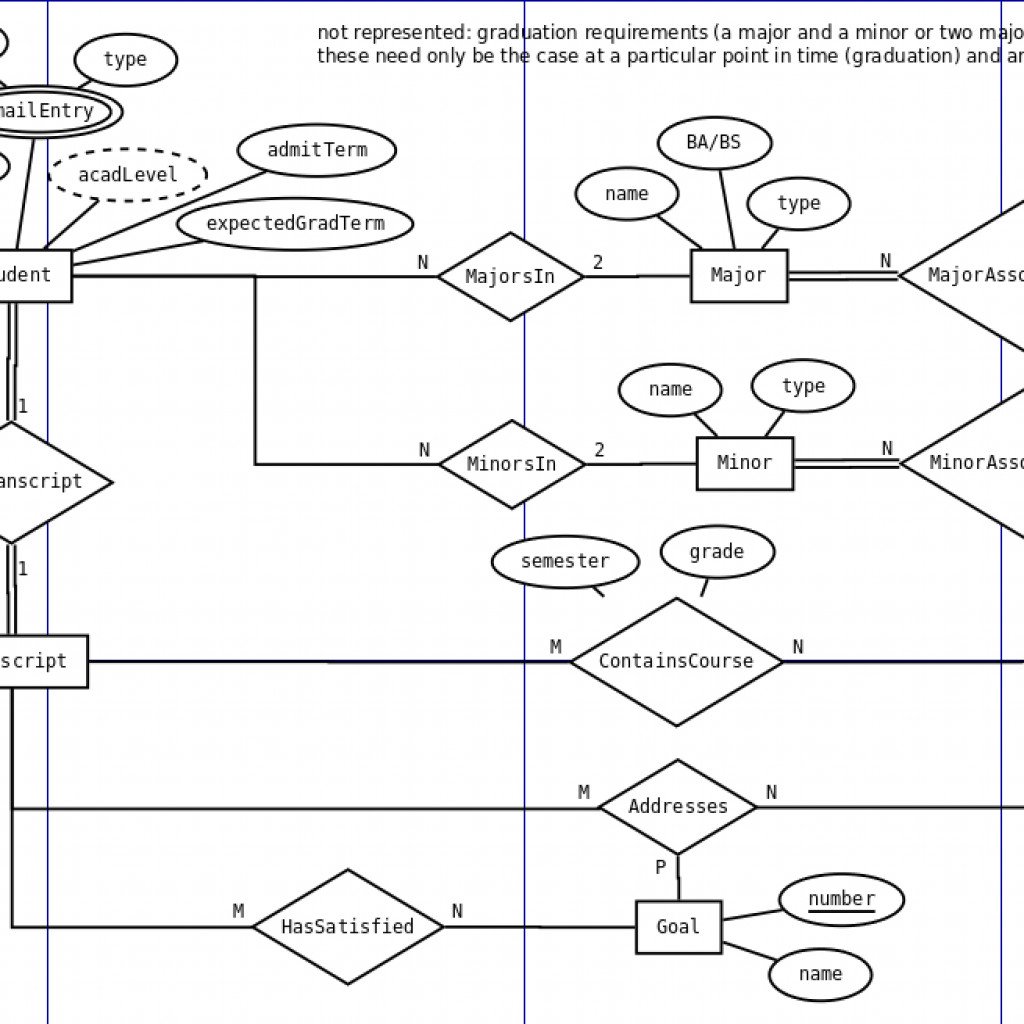
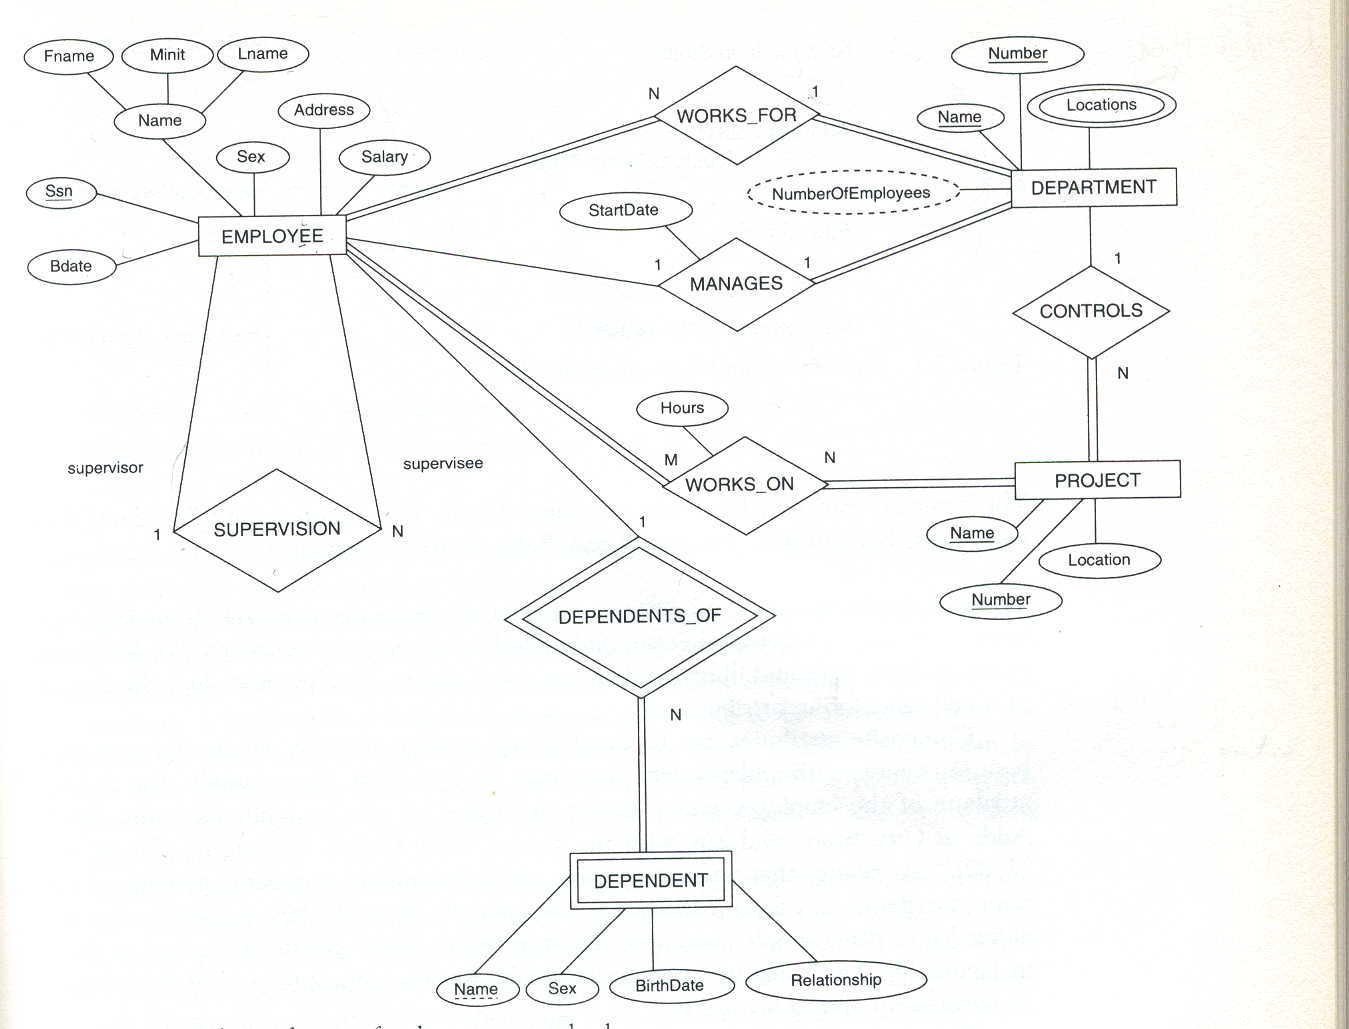
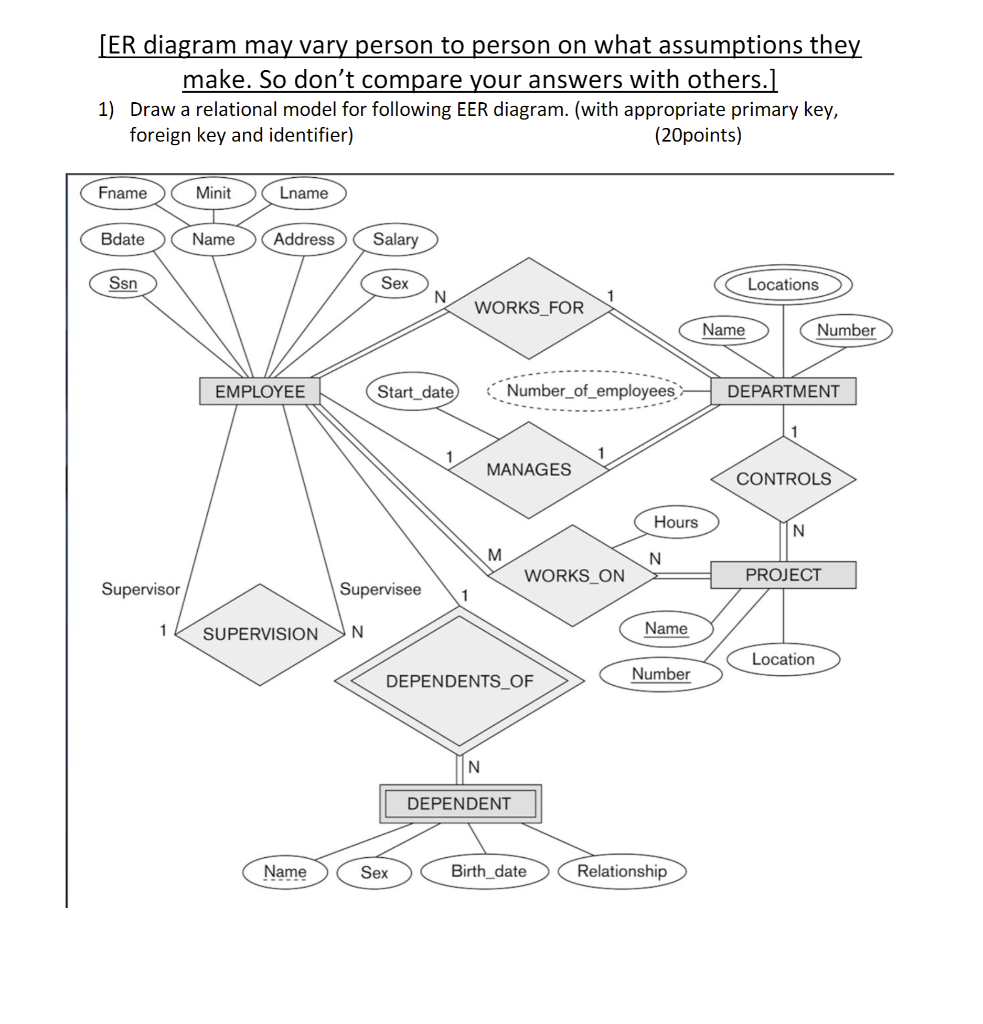
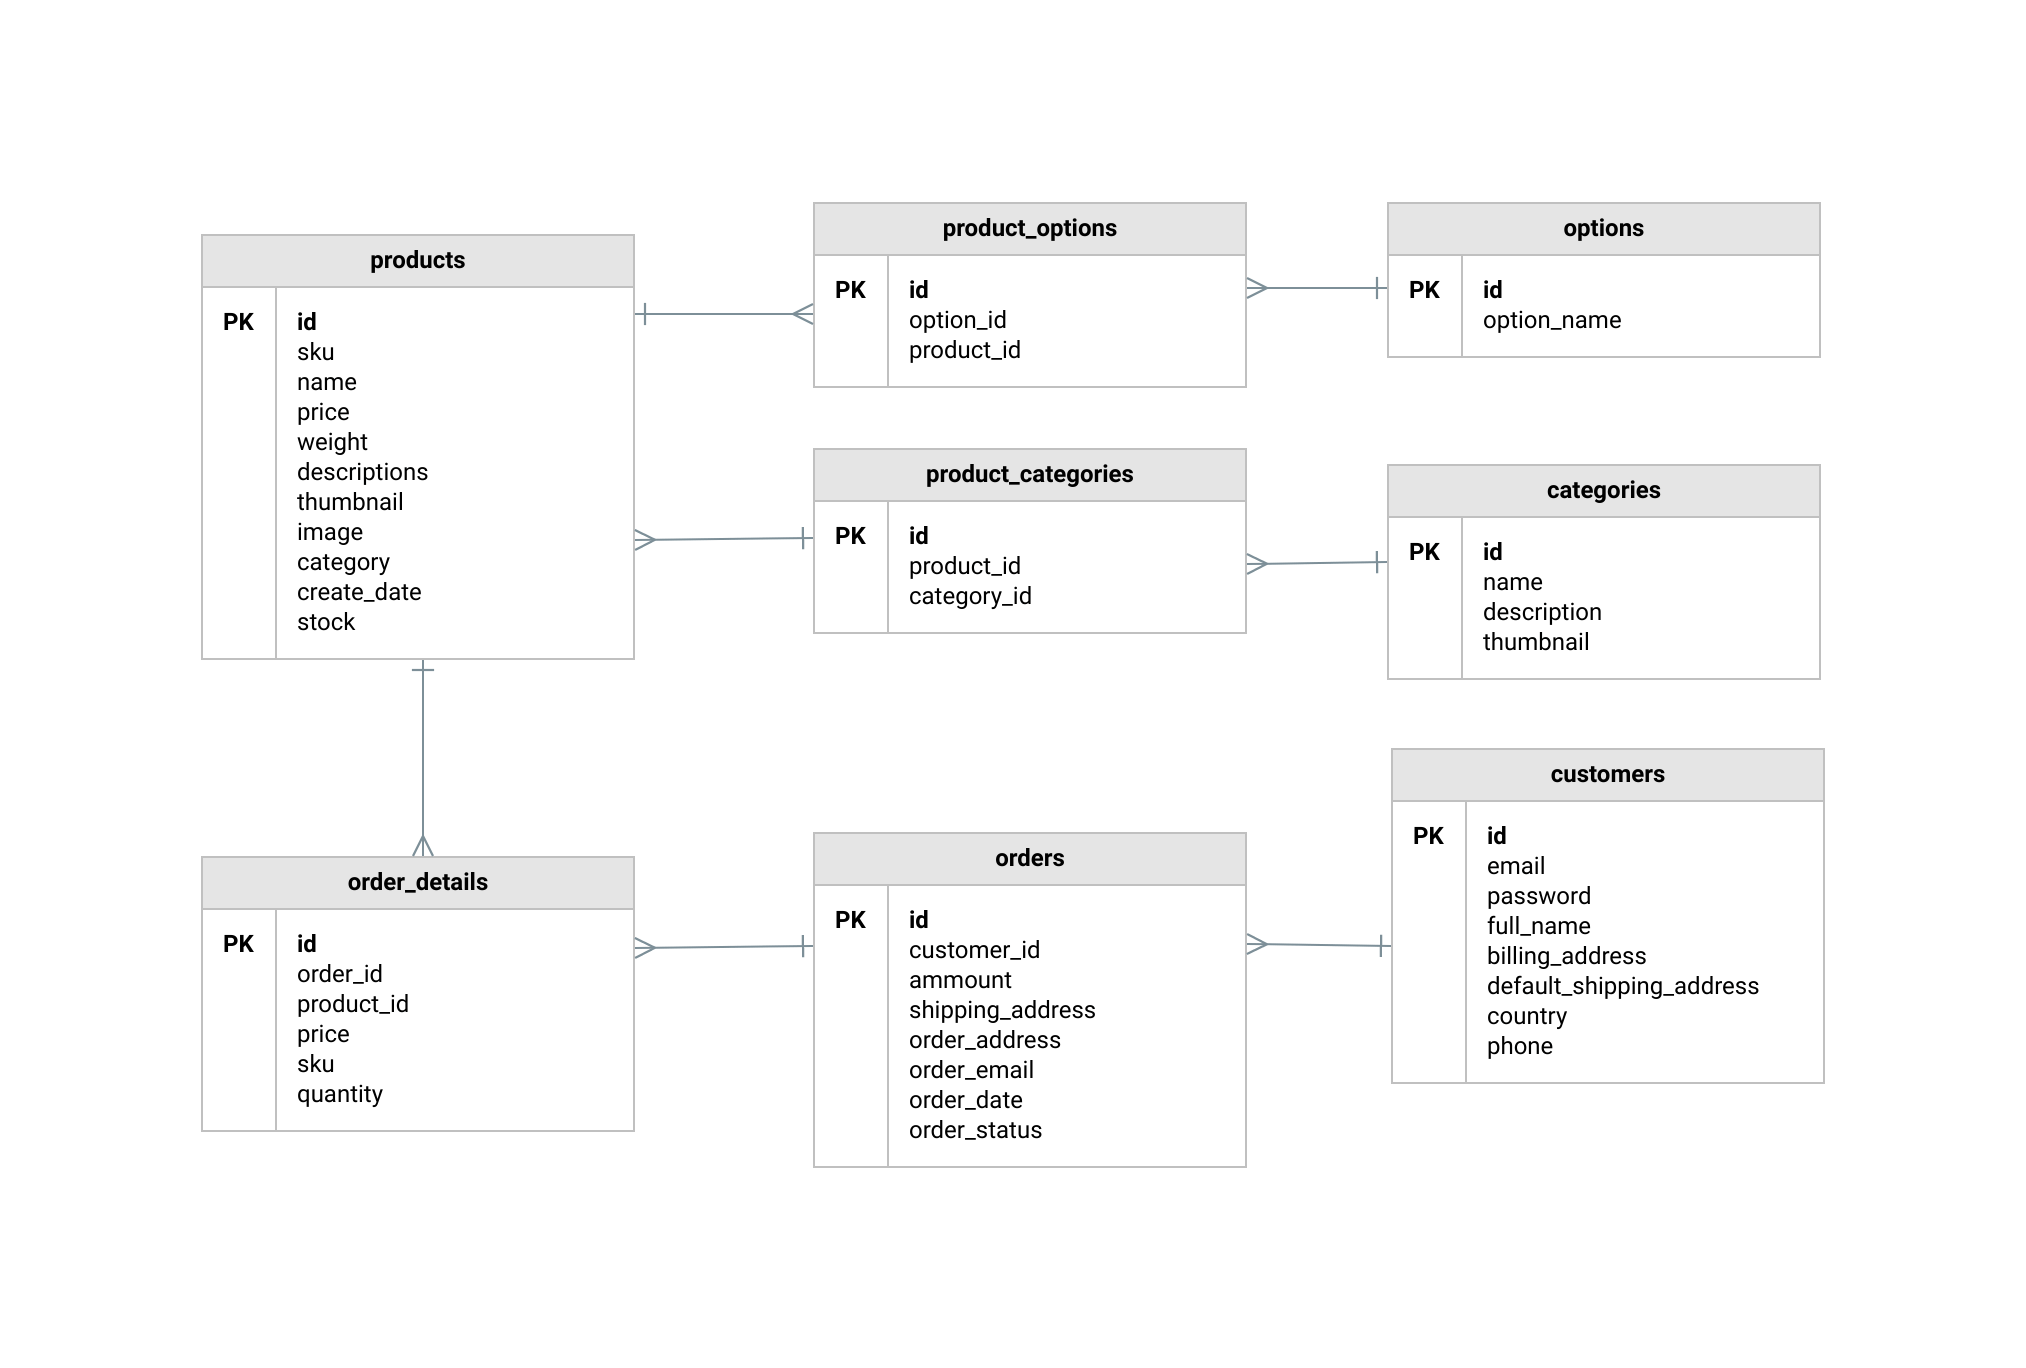
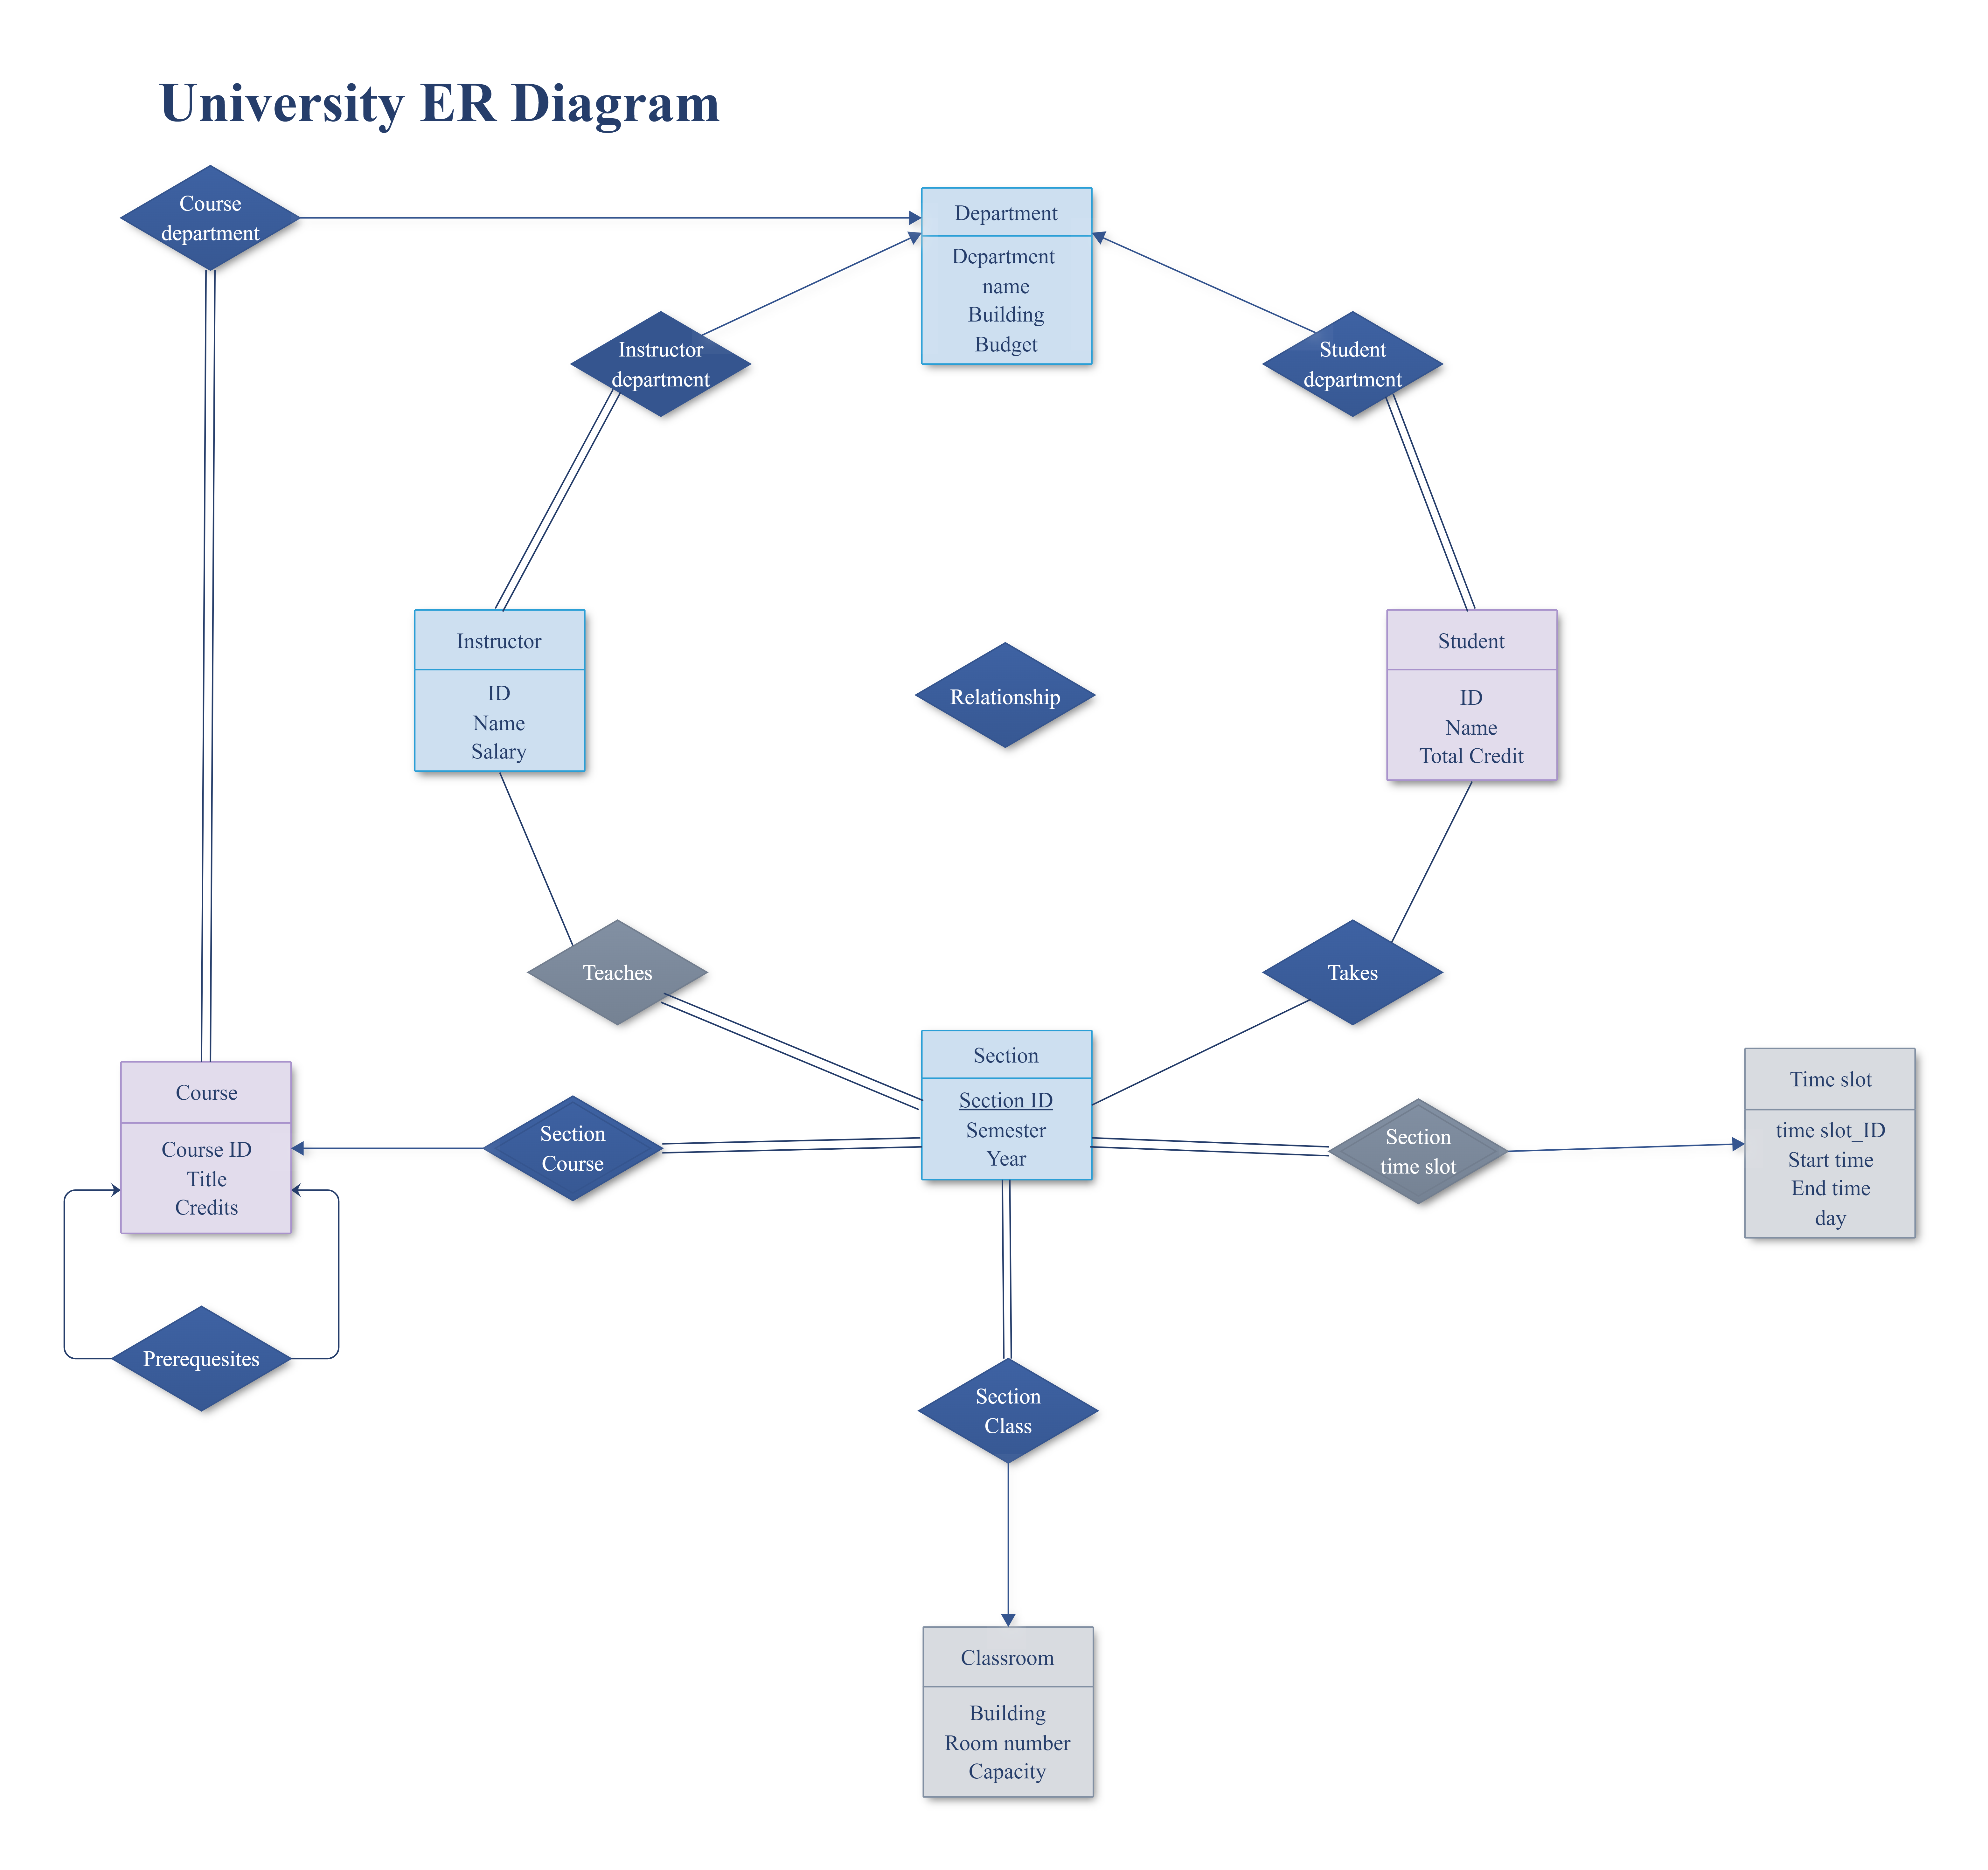
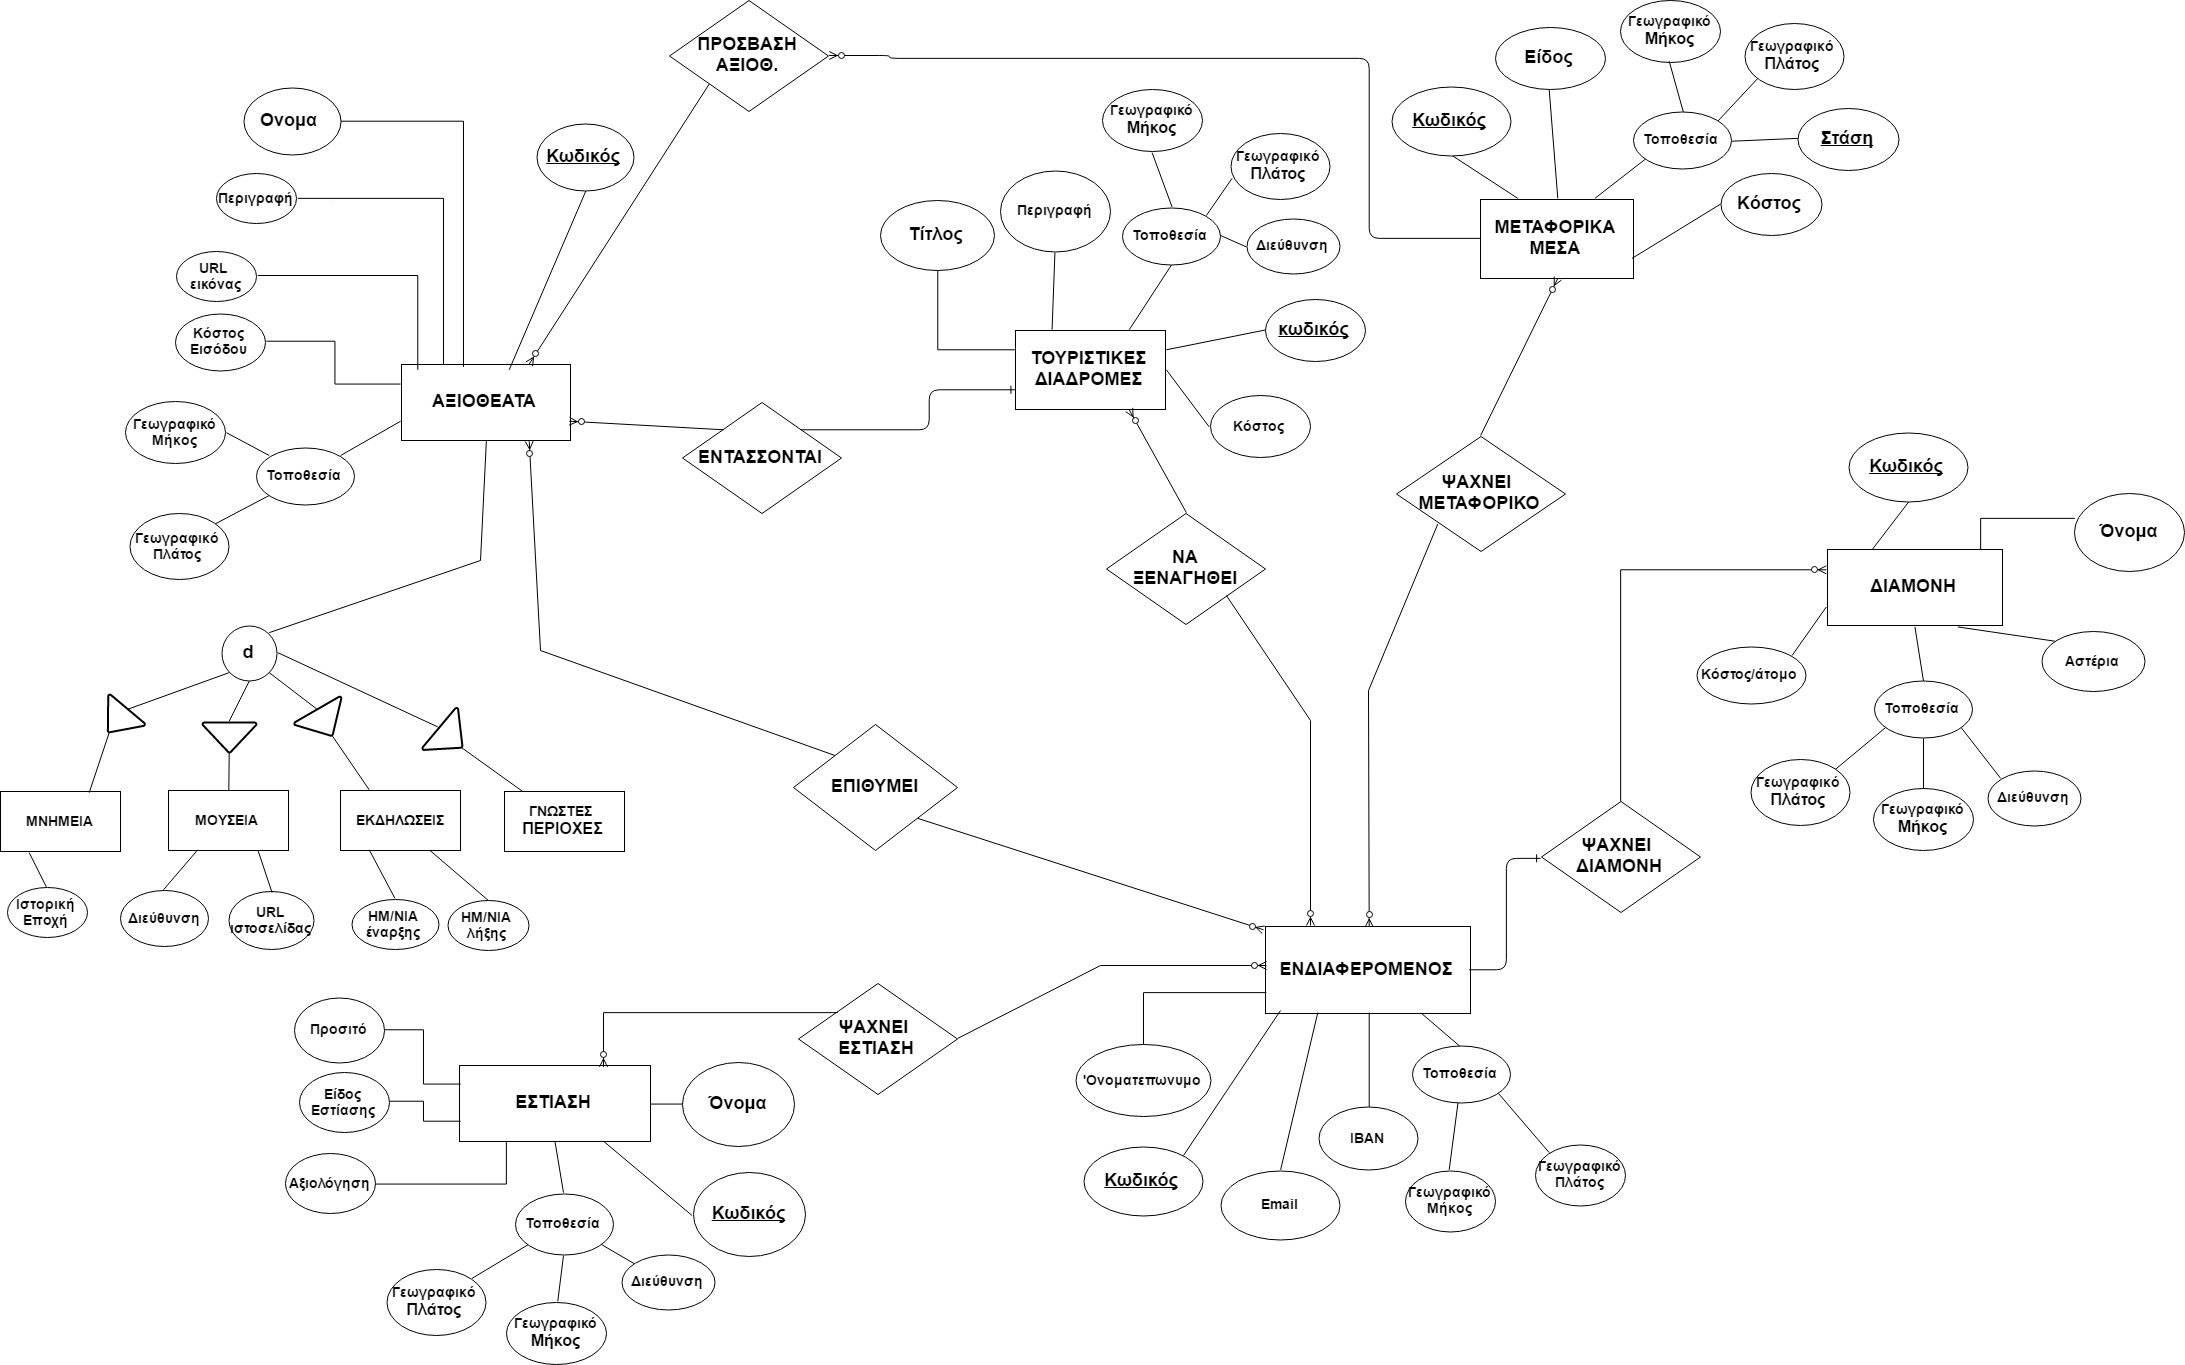
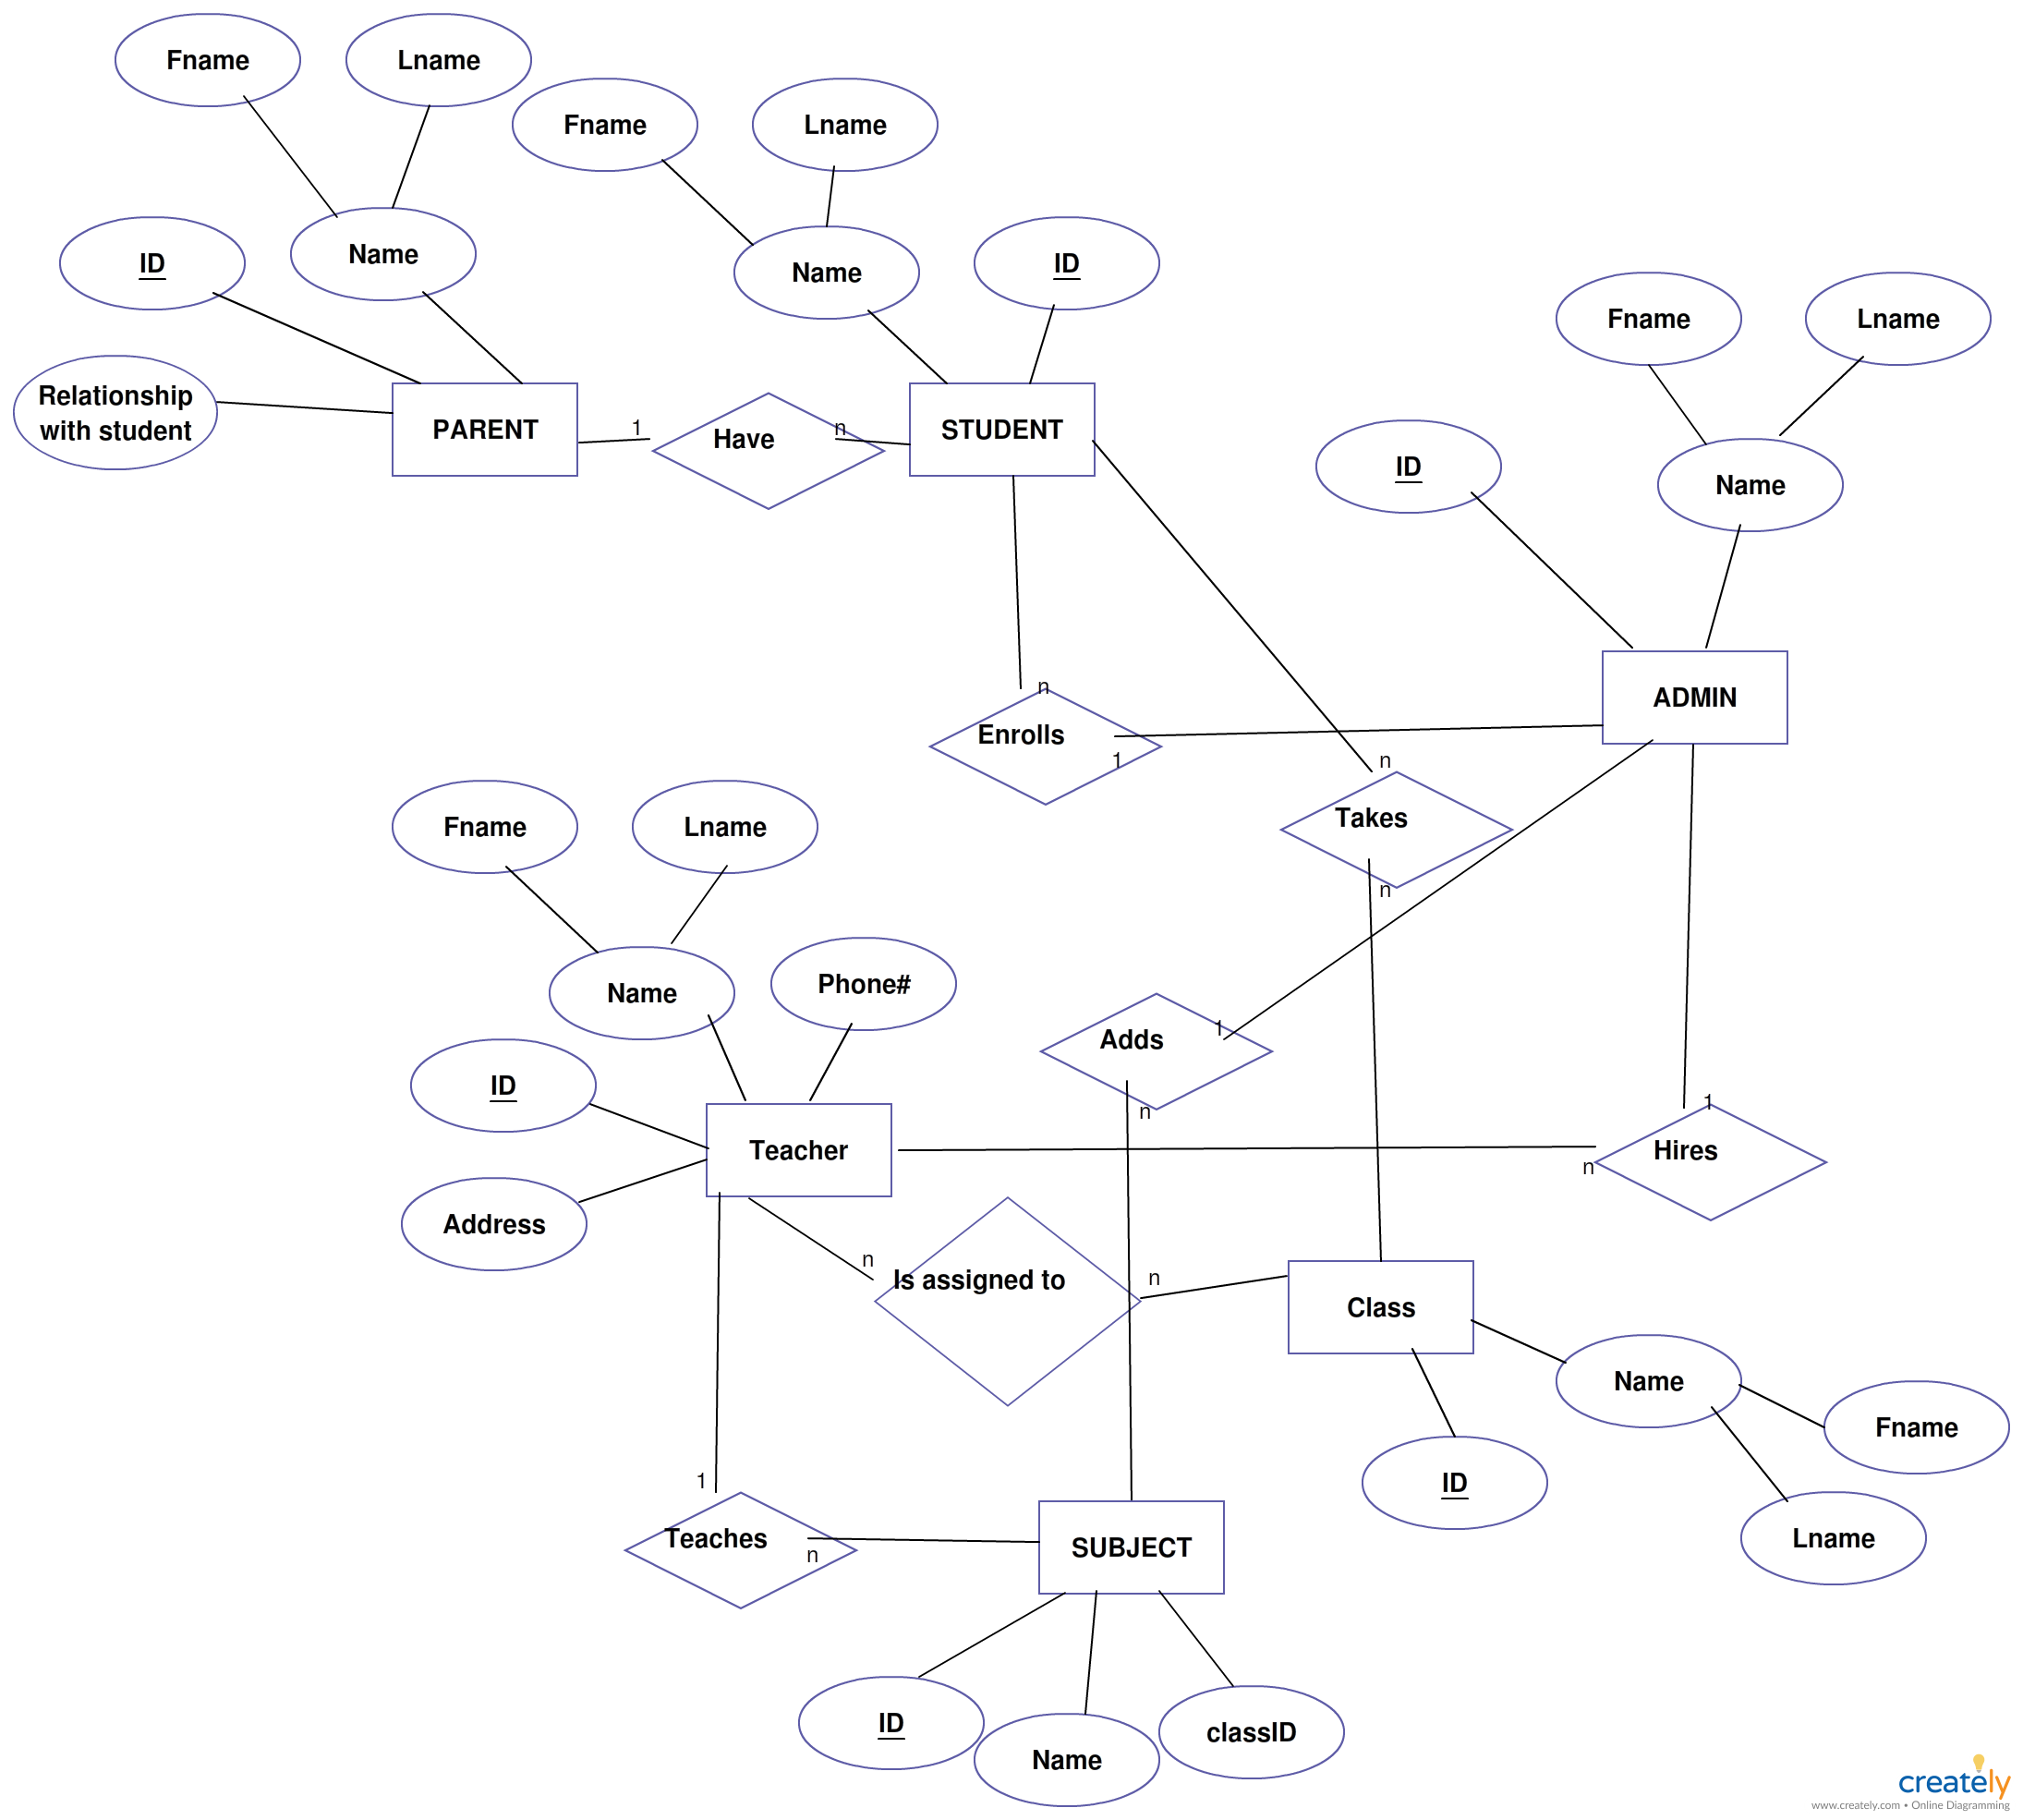
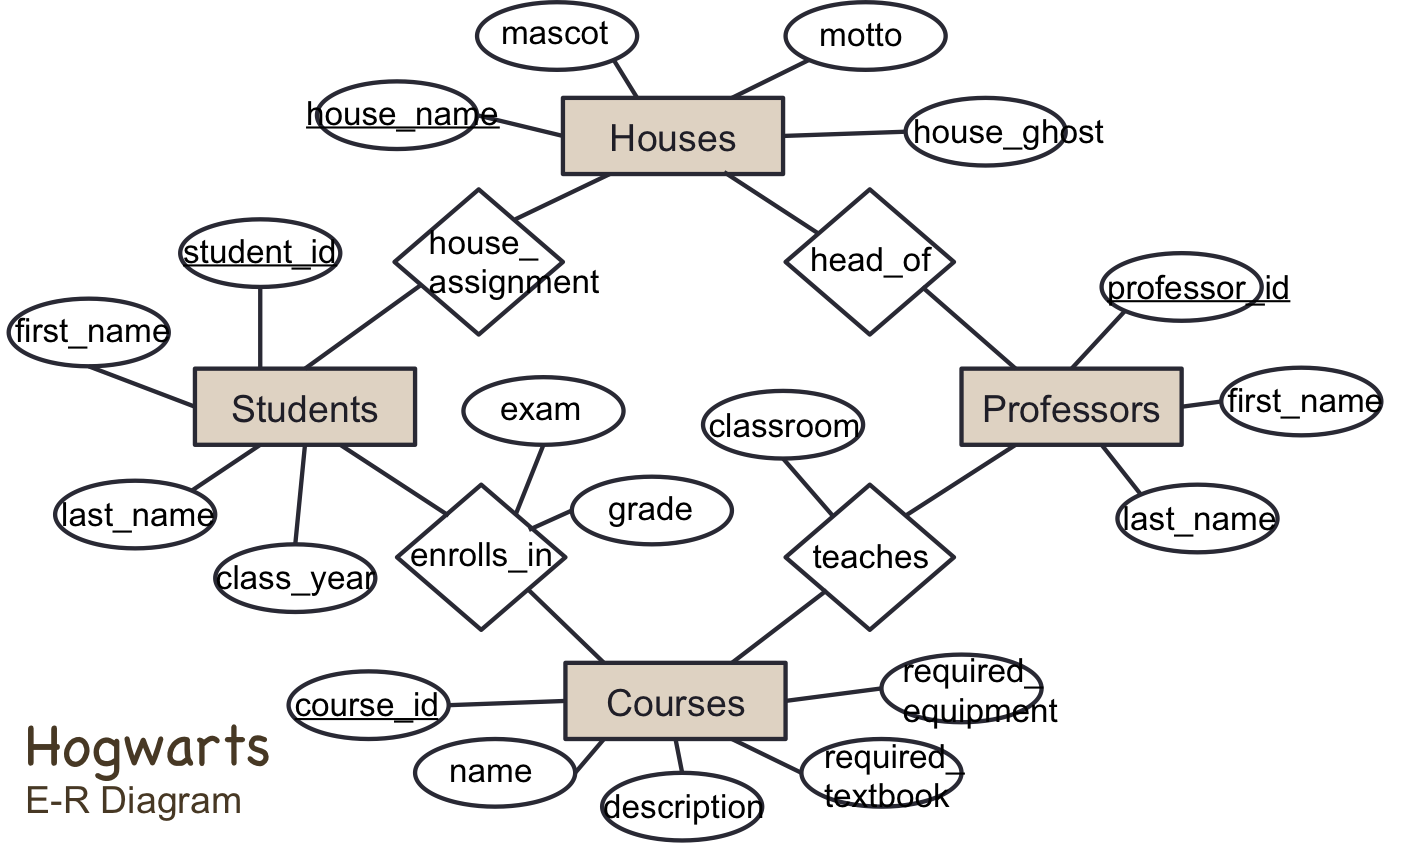
The ER diagram consists of various components like entities, attributes, and relationships. Entities represent real-world objects or concepts, such as customers, products, or employees. Attributes define the characteristics or properties of these entities, like name, age, or address. Relationships illustrate how these entities are connected or associated with each other.
These relationships can be classified into different types, including one-to-one, one-to-many, or many-to-many. They help in understanding the logic behind the data and ensure proper data integrity.
Creating an ER diagram involves identifying and defining entities, attributes, and relationships based on the requirements of the database system. It requires careful analysis and understanding of the business or system being modeled. Once the diagram is complete, it serves as a blueprint for creating the actual database structure.
ER diagrams are widely used in software development, database design, and system analysis. They assist in clear communication and collaboration between stakeholders, ensuring that everyone involved understands the database structure and relationships.
In conclusion, an ER diagram is a valuable tool in visualizing the relationships and structure of a database system. By providing a clear representation of entities, attributes, and relationships, it aids in the efficient design and development of databases.