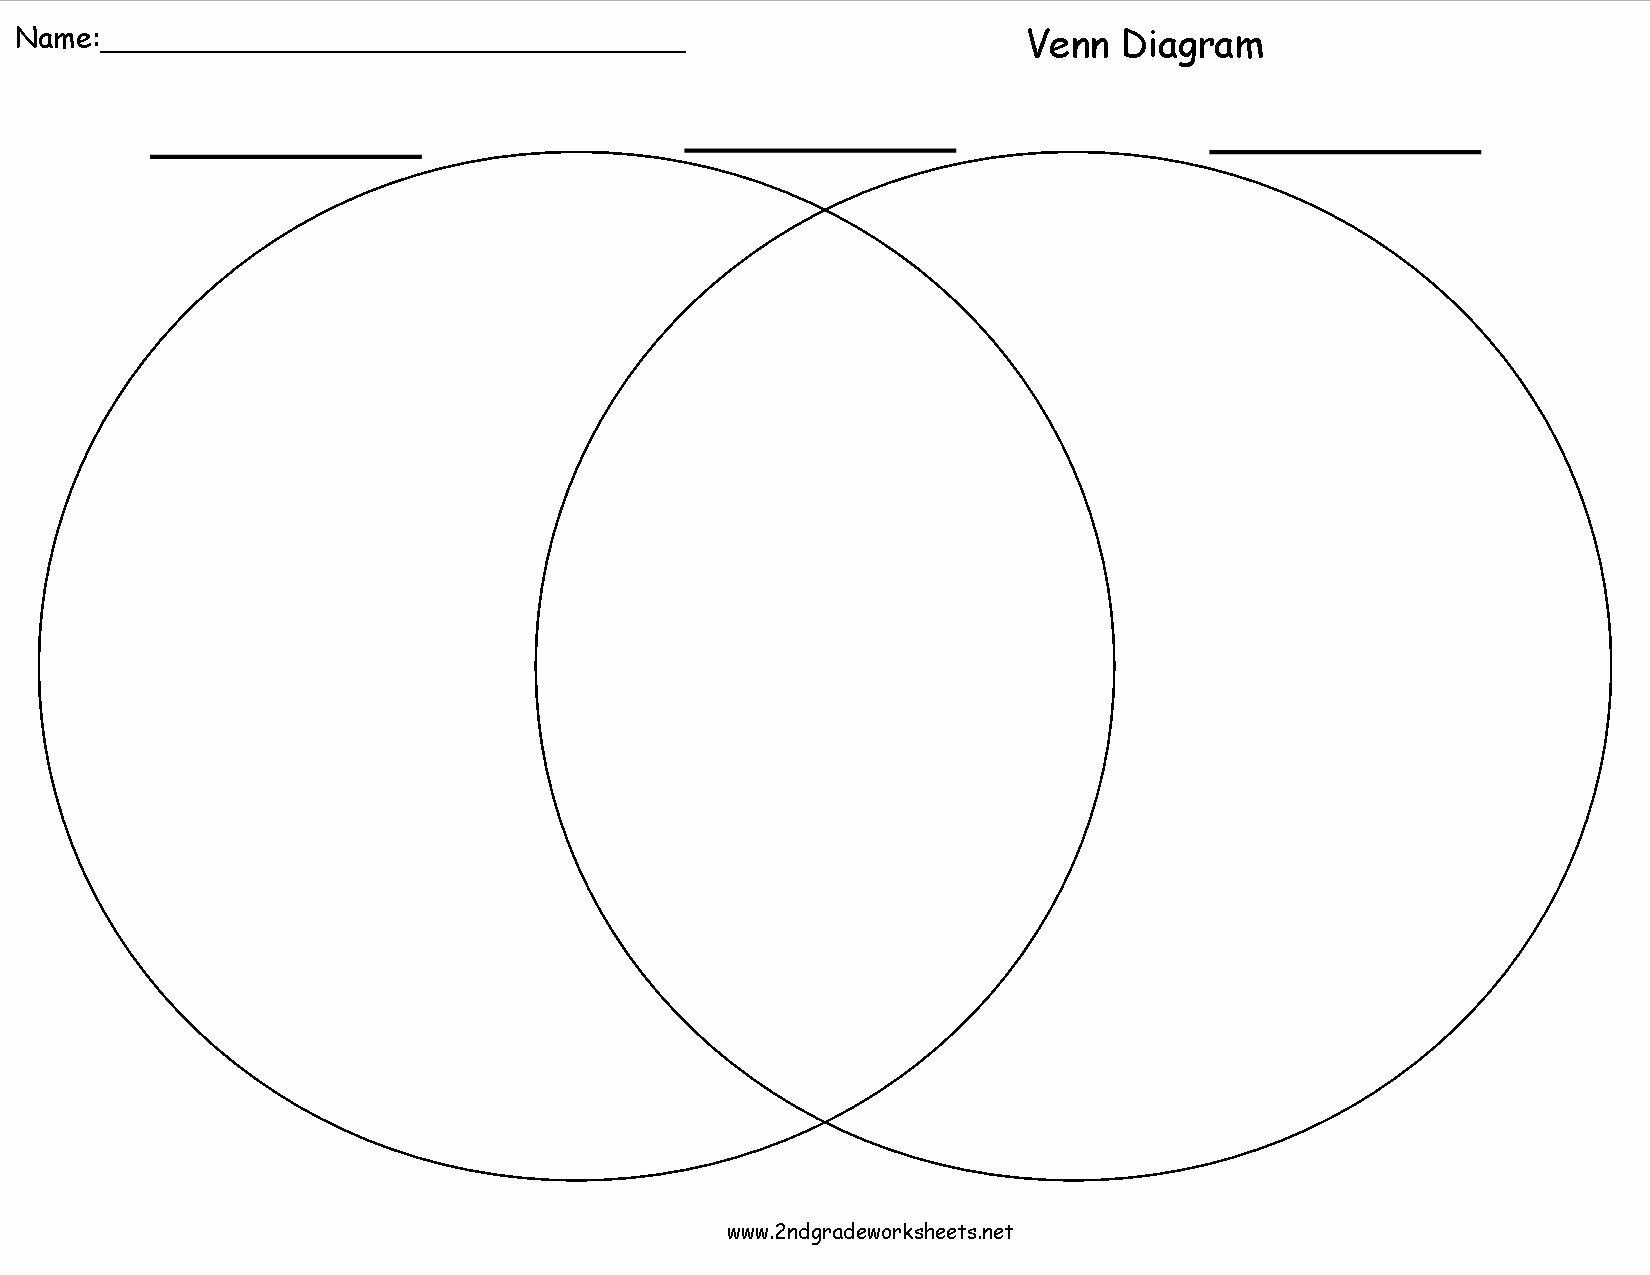
Venn diagrams examples
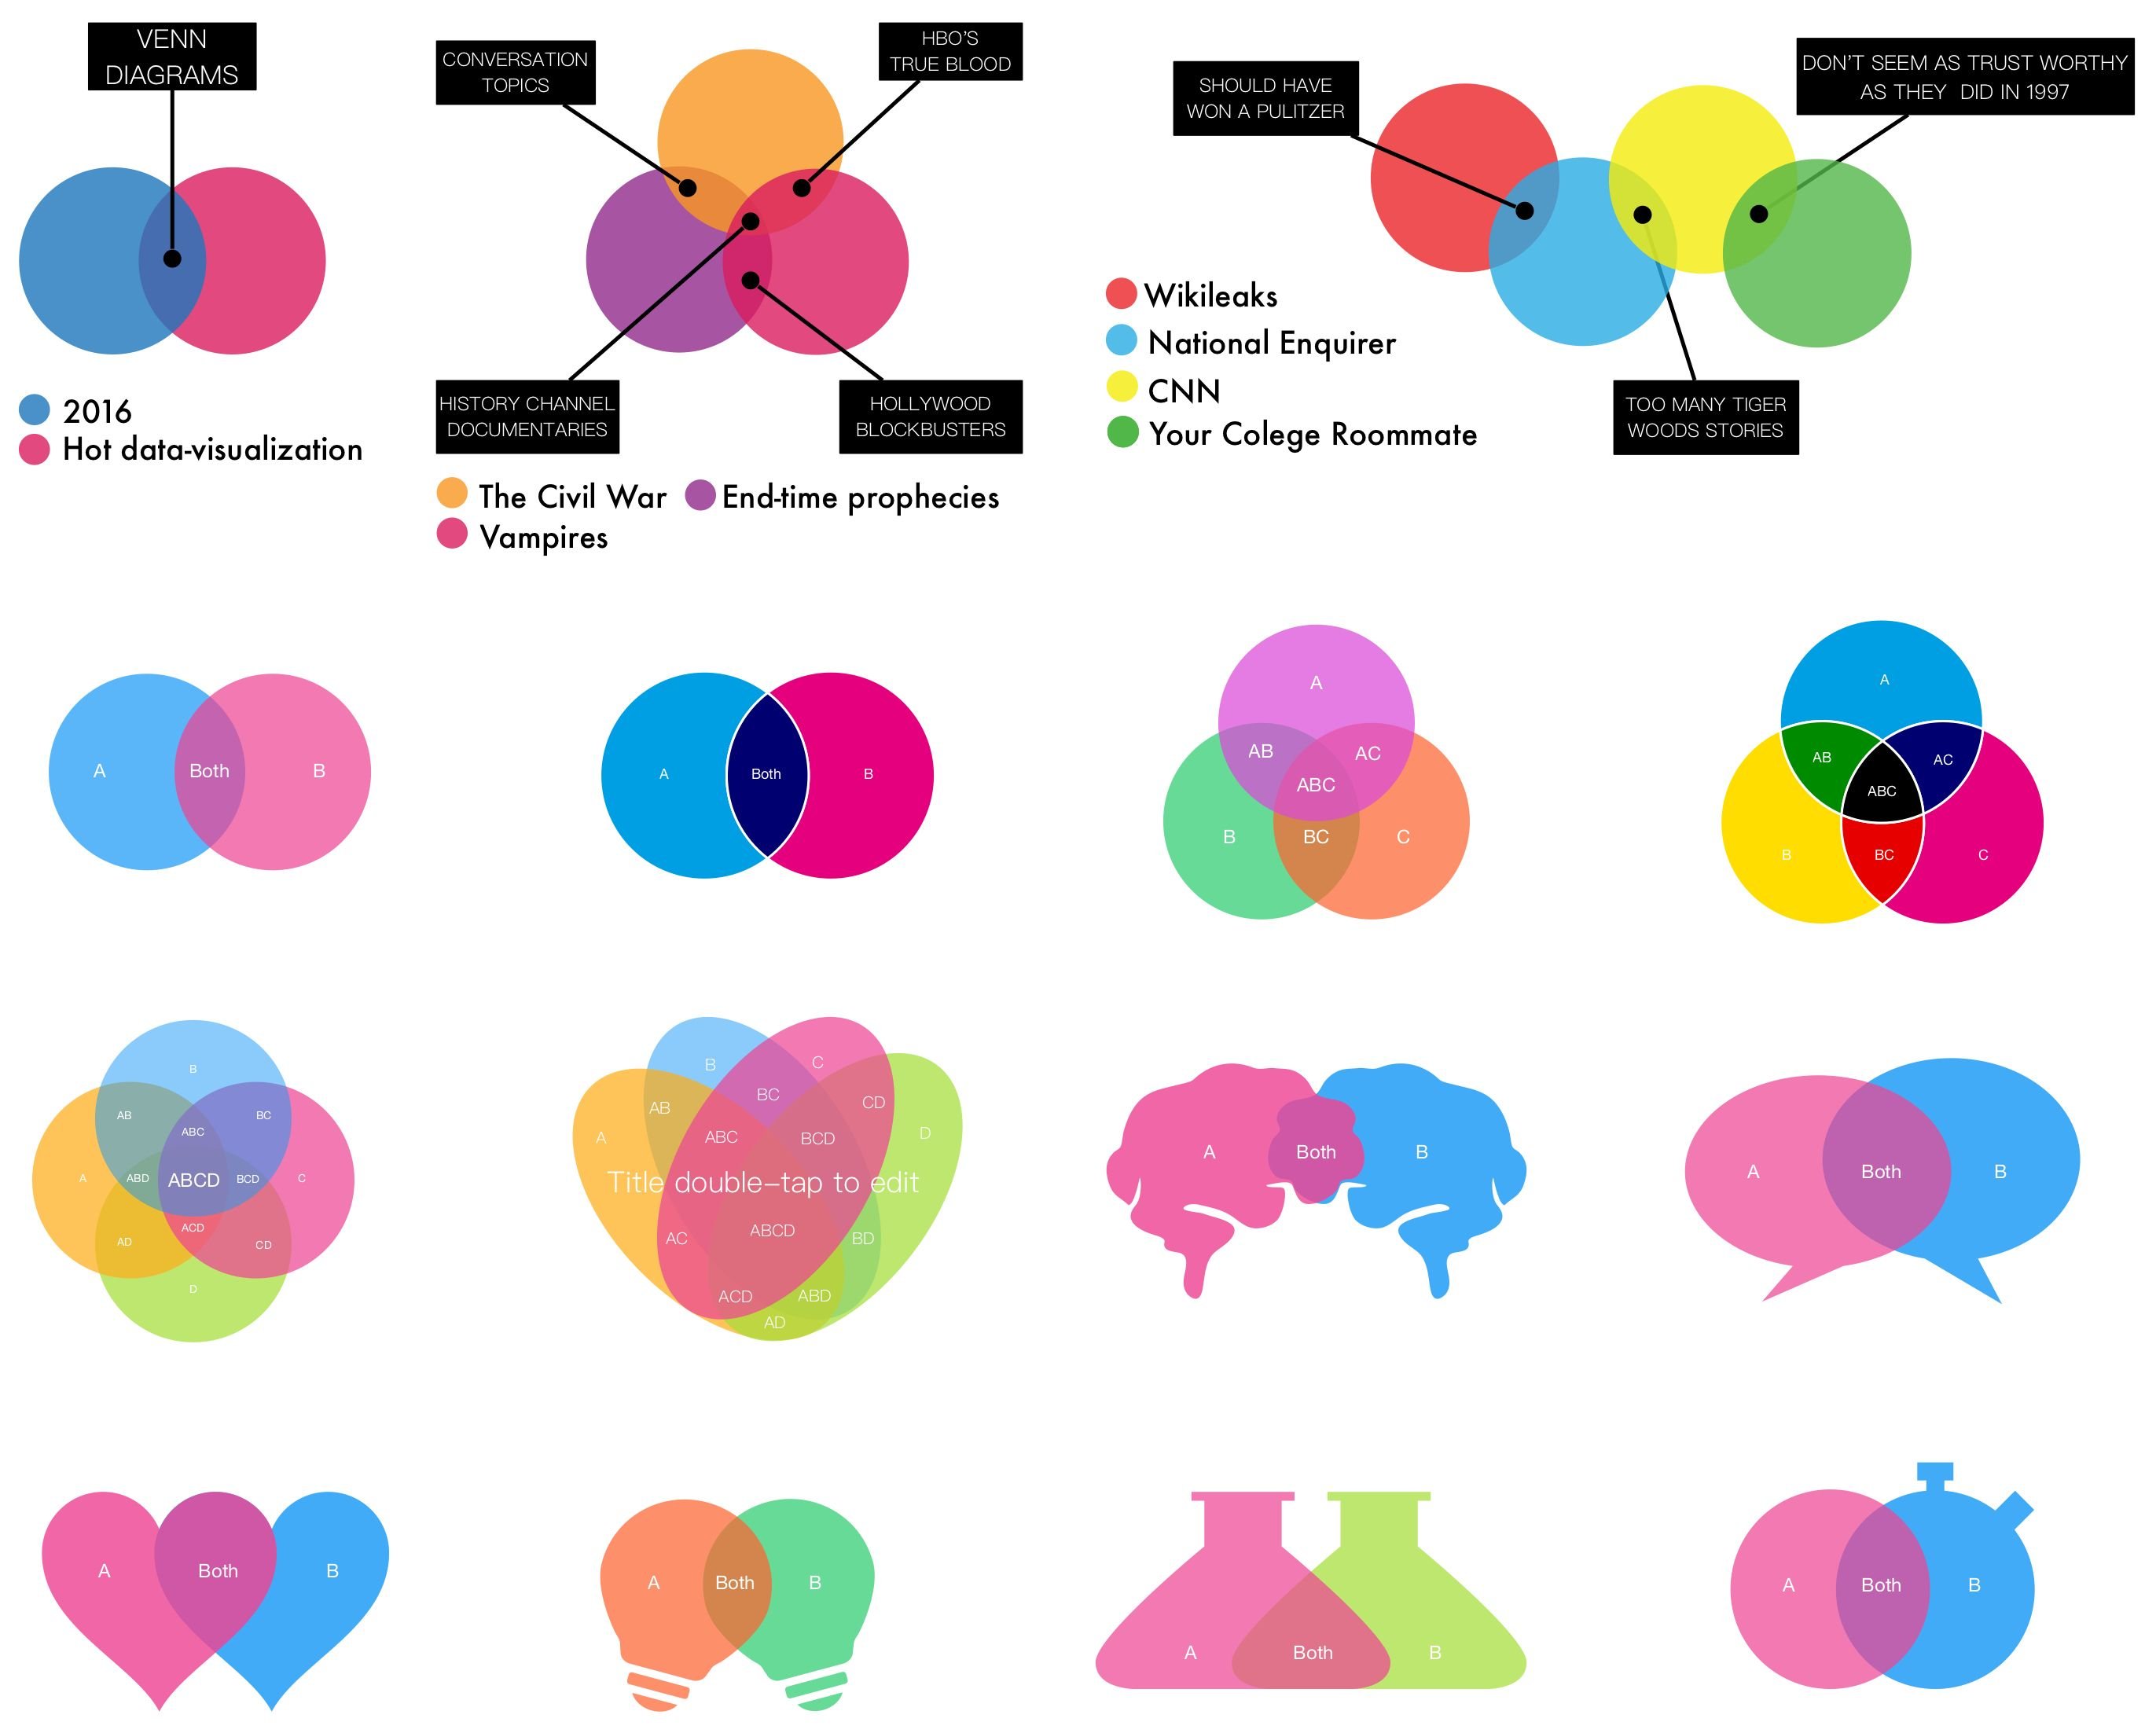
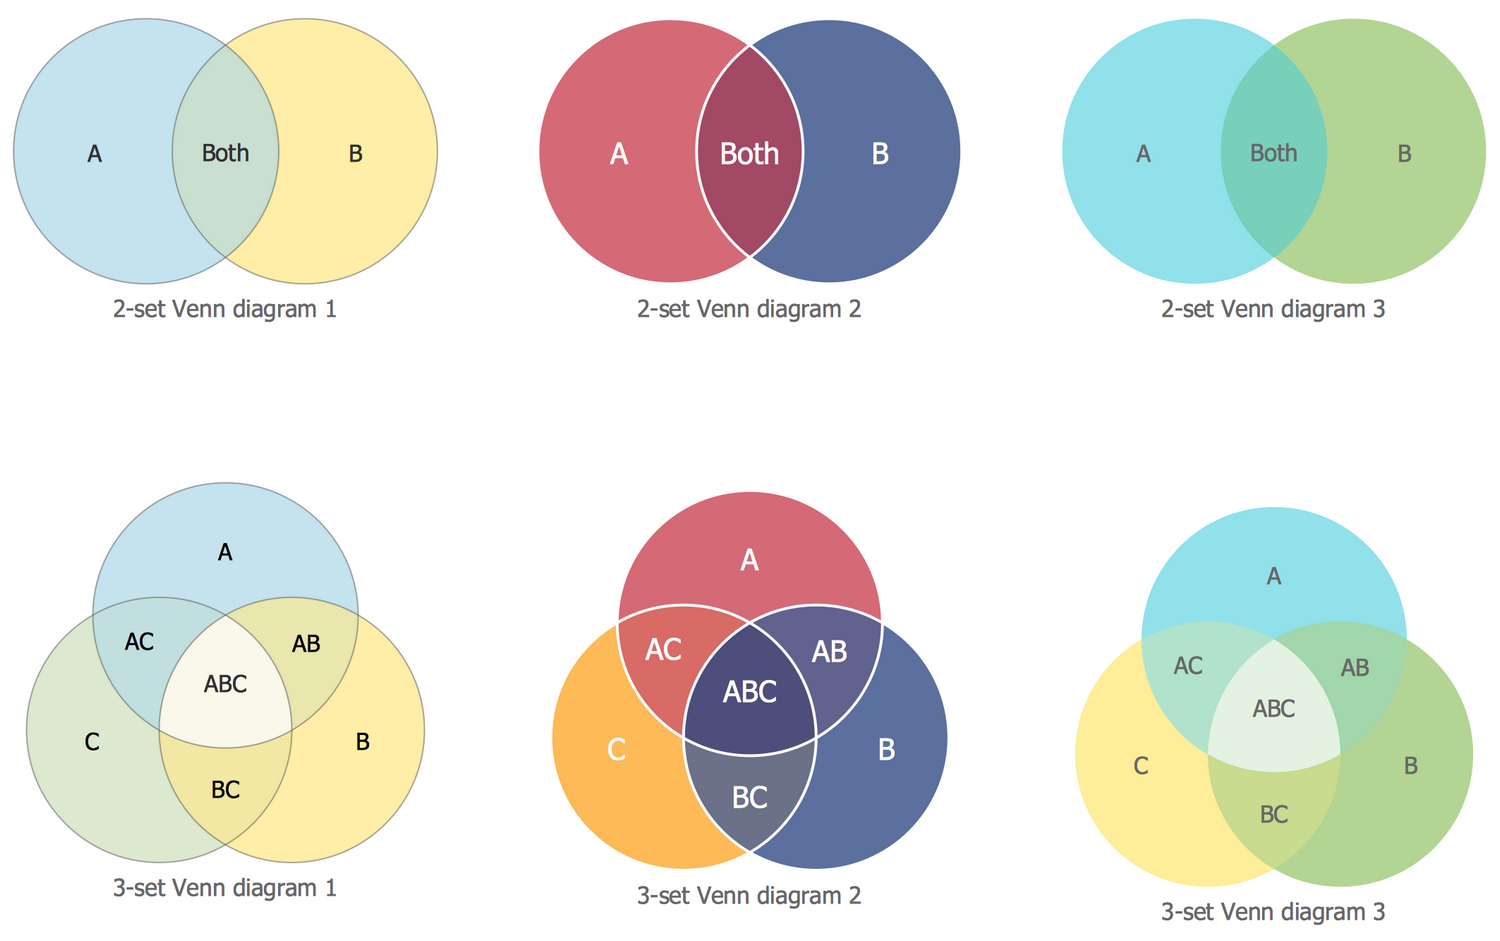
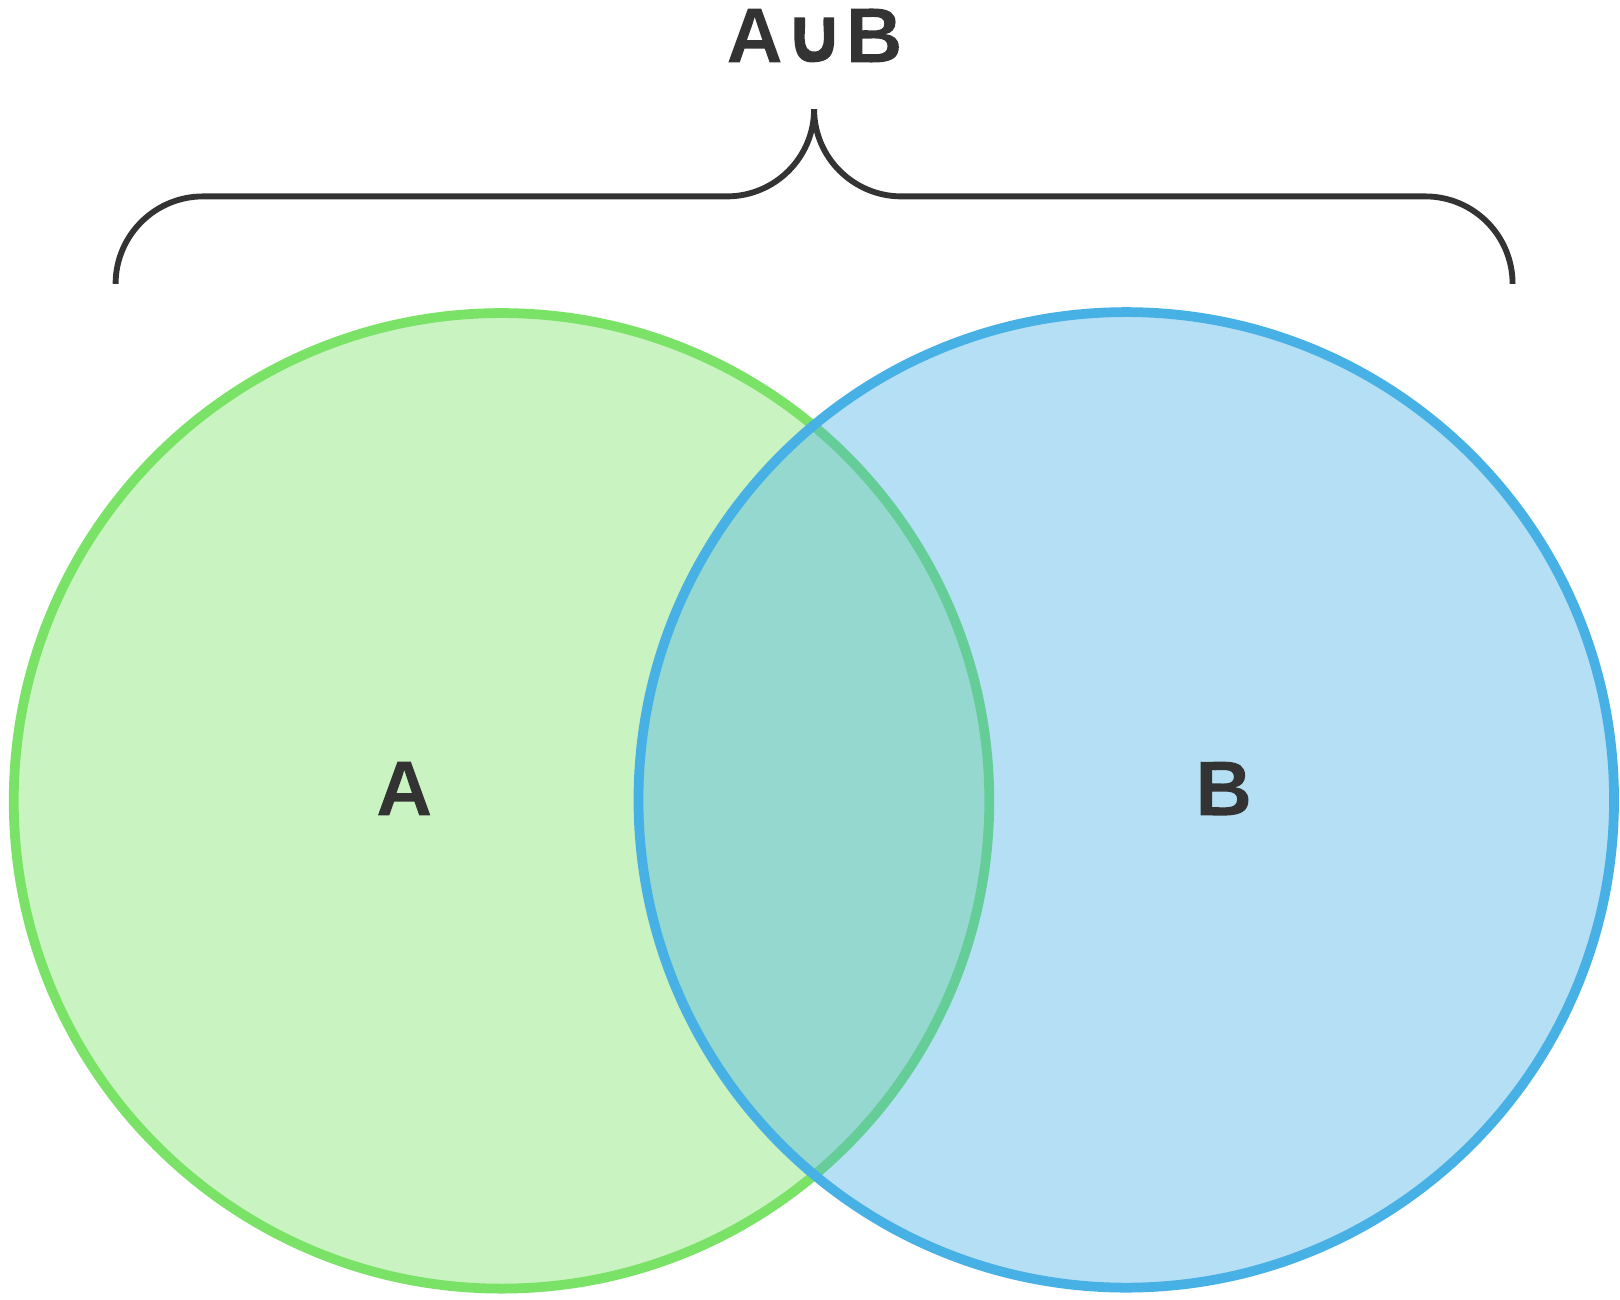
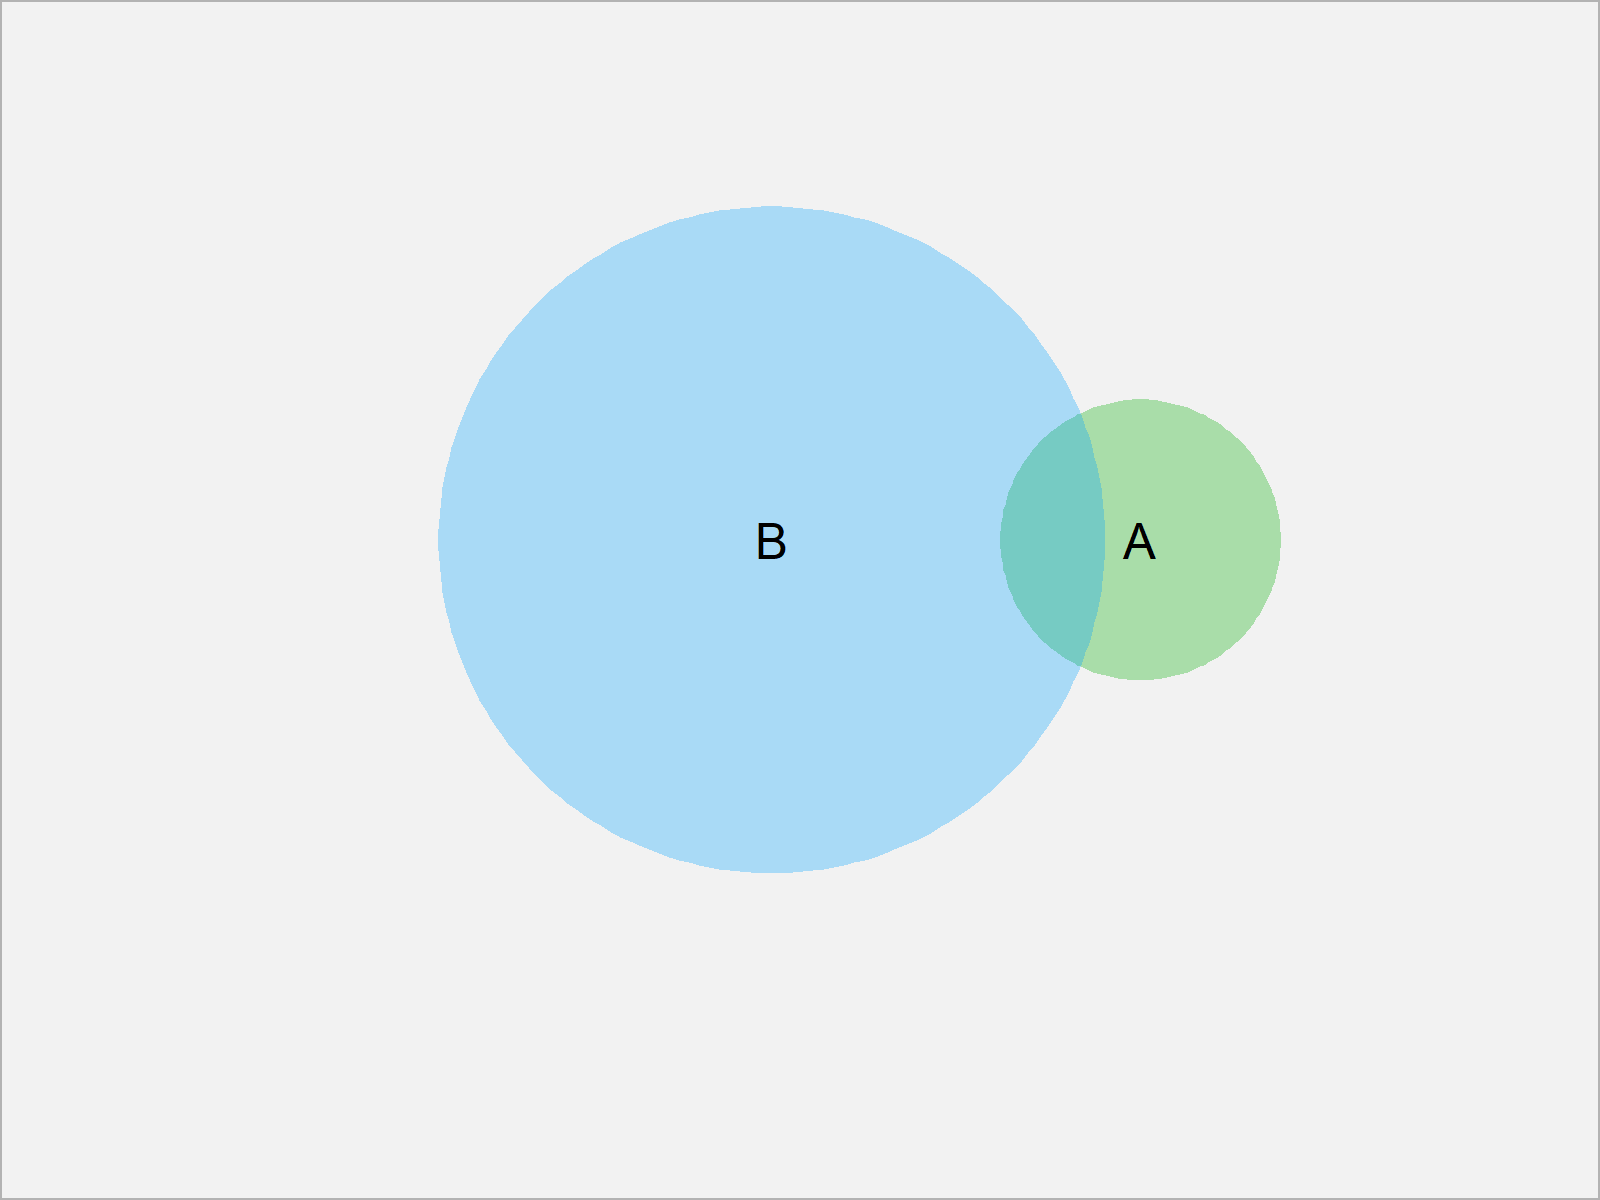
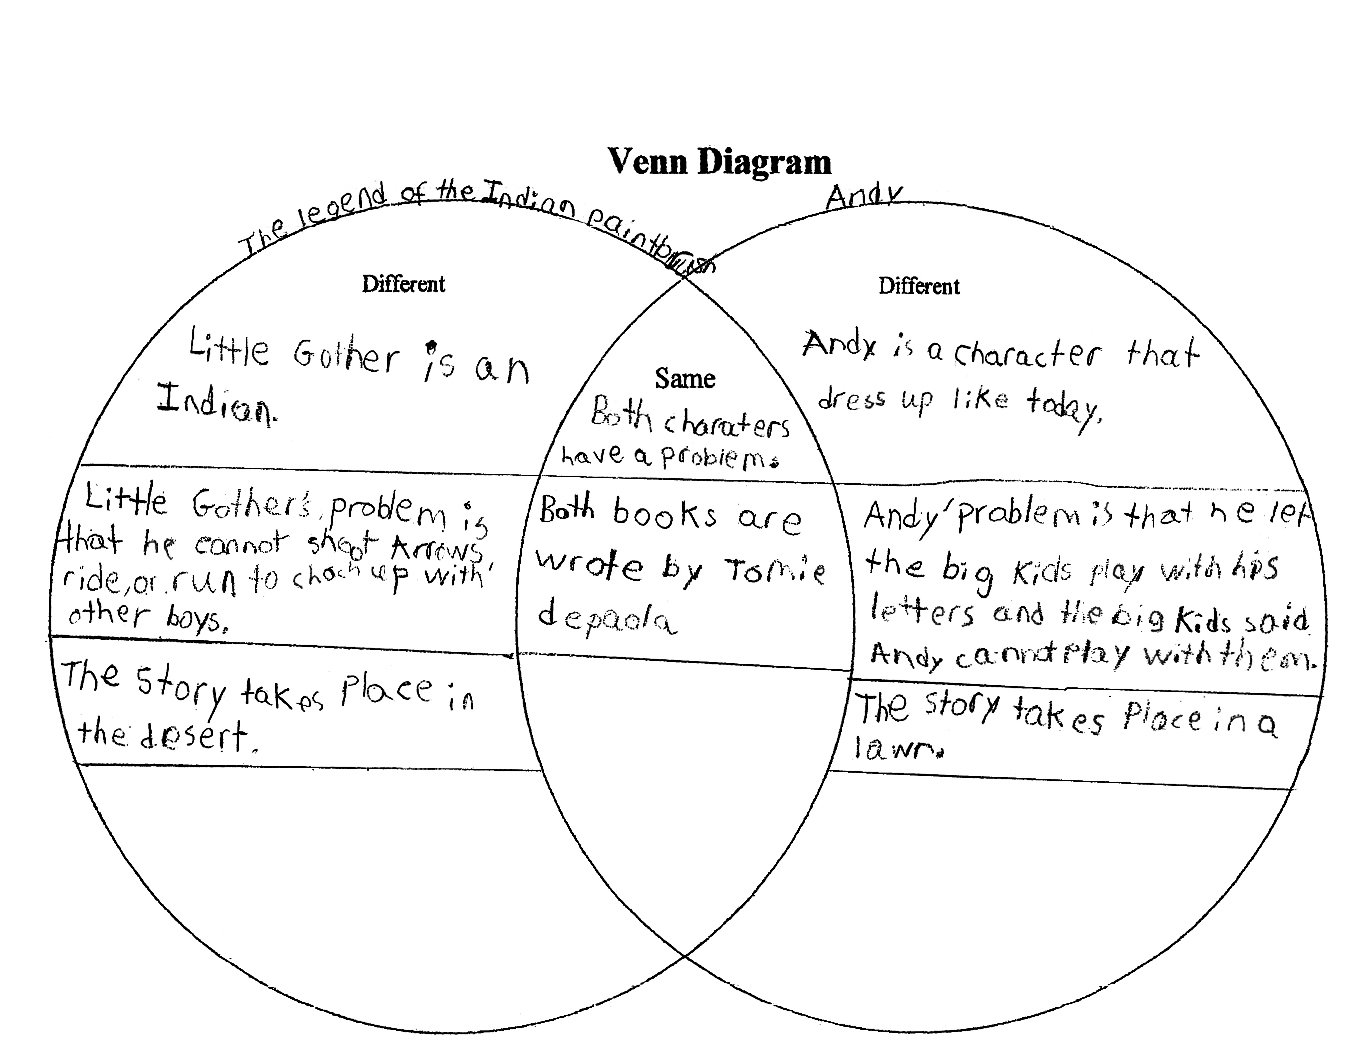
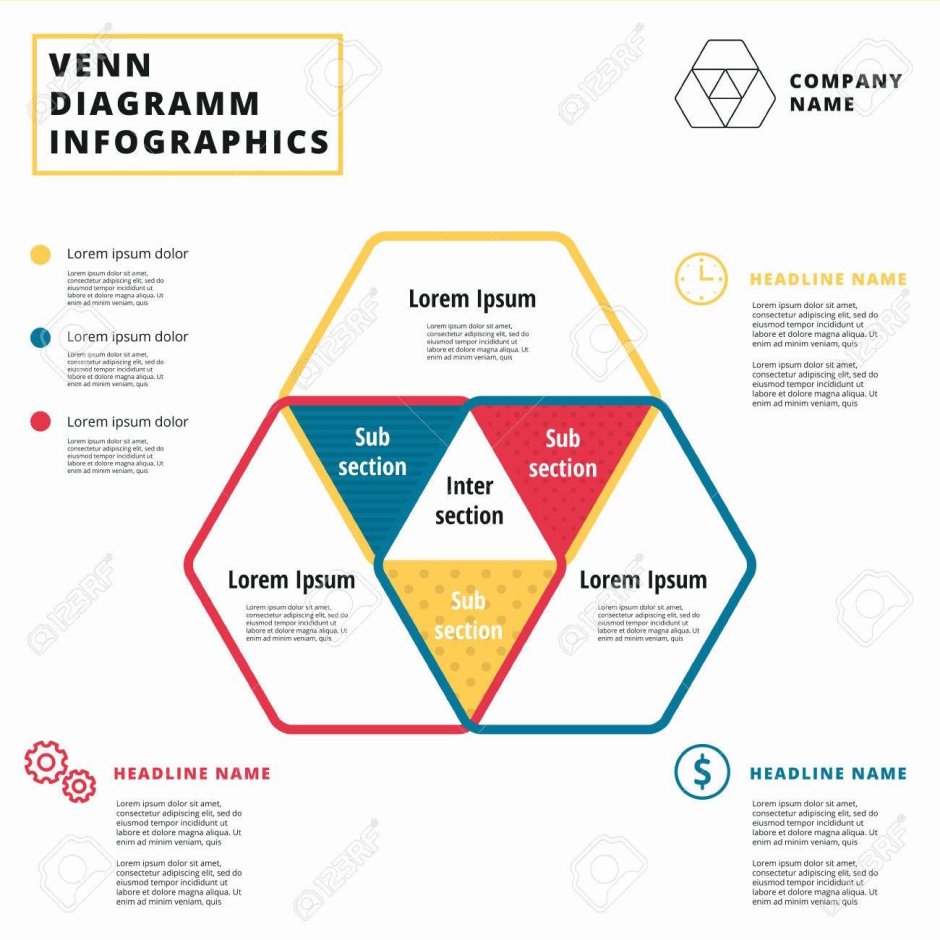
Venn diagrams are a powerful tool used in various fields to visually represent relationships and comparisons between different sets of data or entities. These diagrams consist of overlapping circles or shapes, where each circle represents a set and the overlapping portions represent the common elements shared by those sets.
For instance, in mathematics, Venn diagrams are commonly used to illustrate concepts related to sets and logic. They can depict operations such as union, intersection, and complementation, helping students better understand complex mathematical concepts.
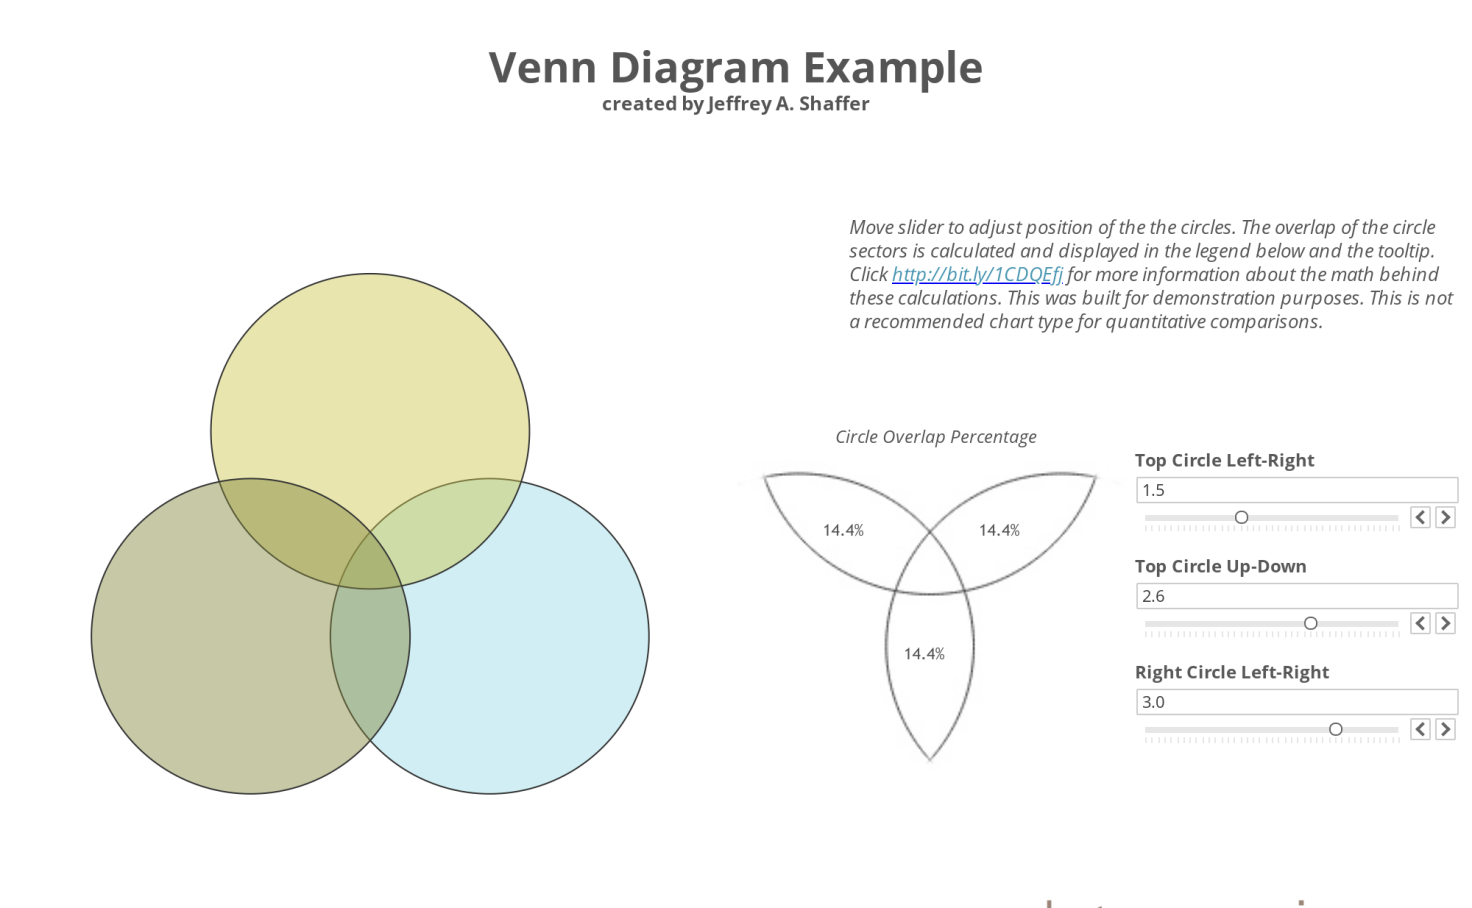
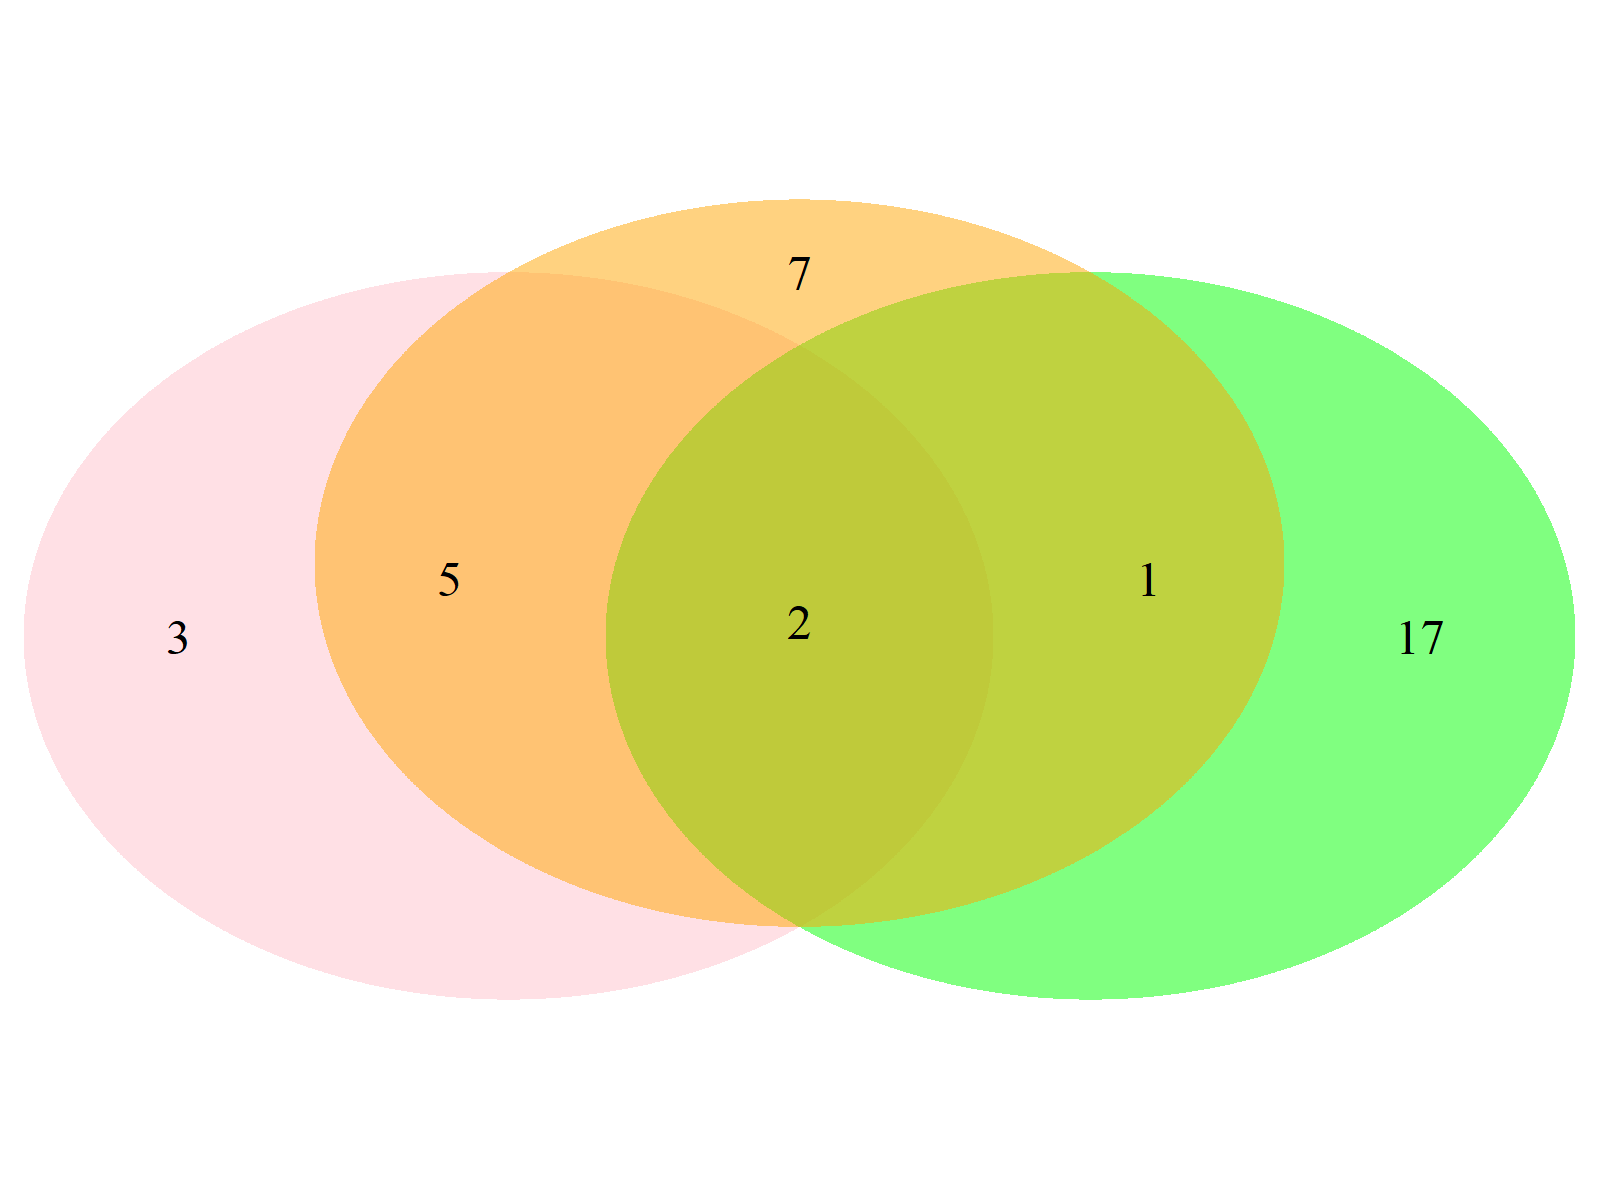
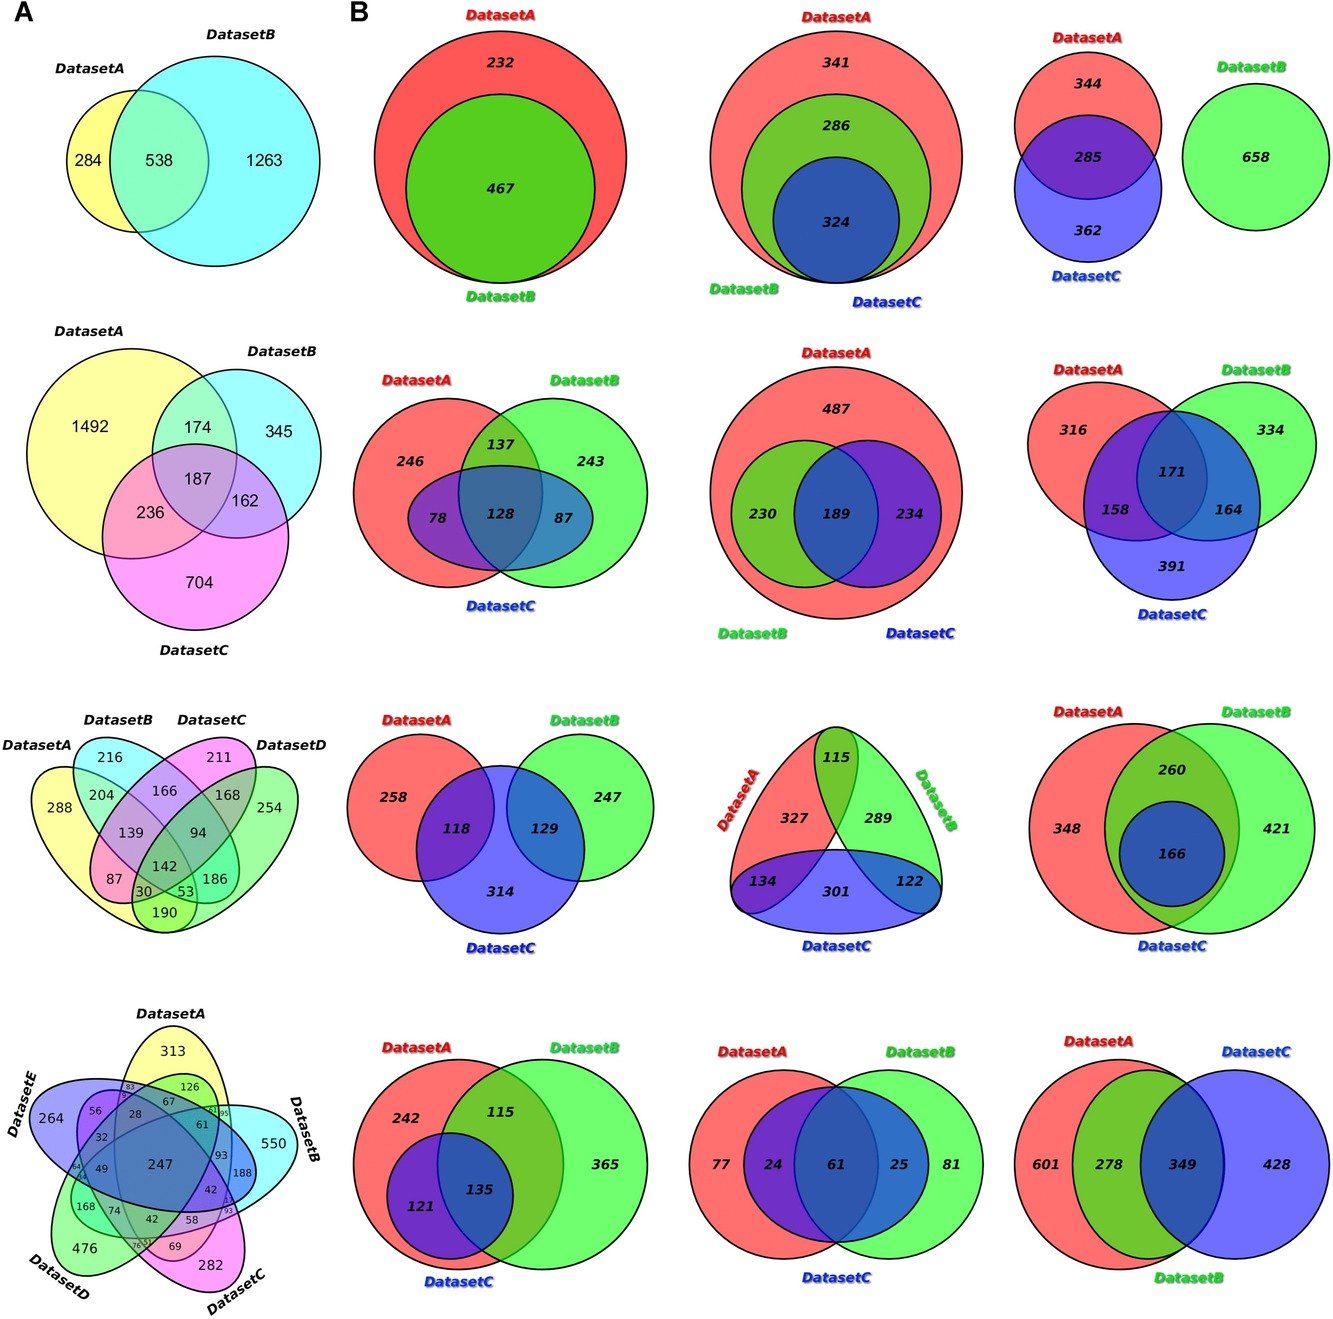
In statistics, Venn diagrams can be employed to analyze data sets and identify patterns or correlations between different variables. By representing the overlap between sets, researchers can easily spot trends or connections that may otherwise go unnoticed.
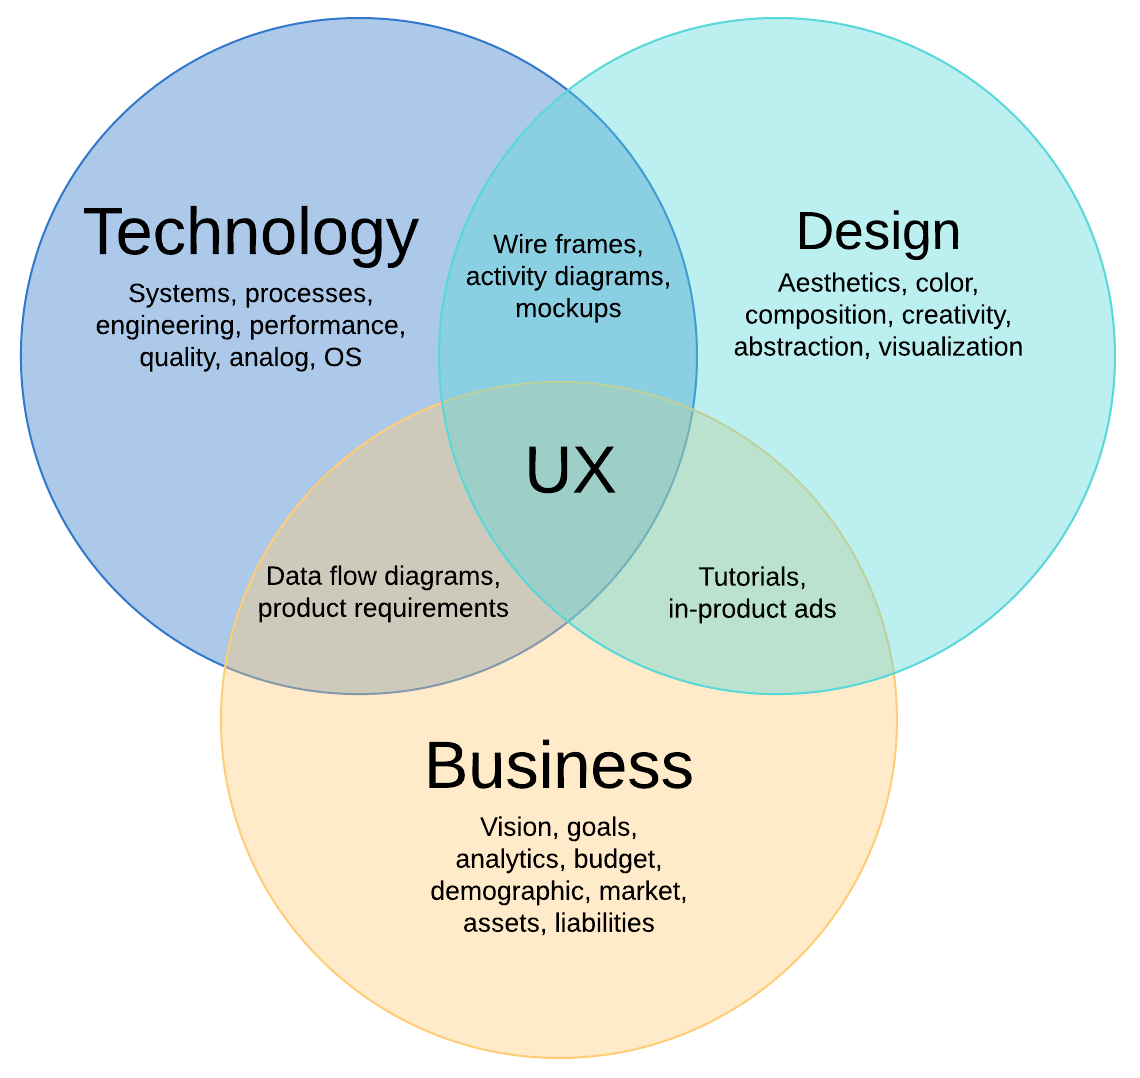
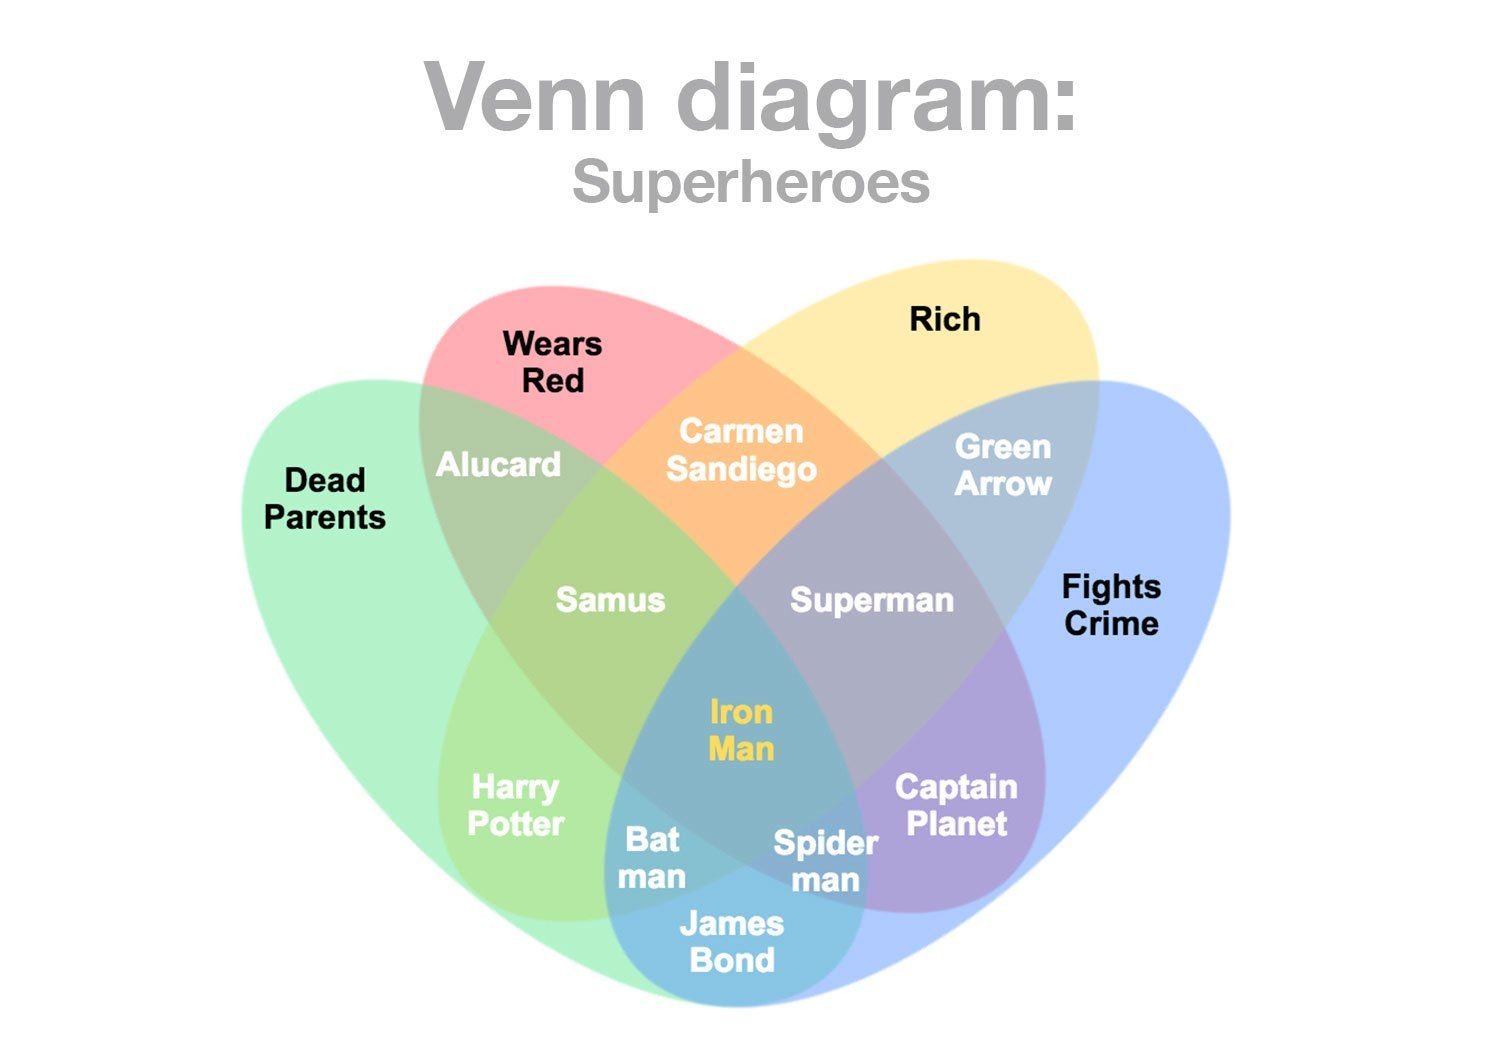
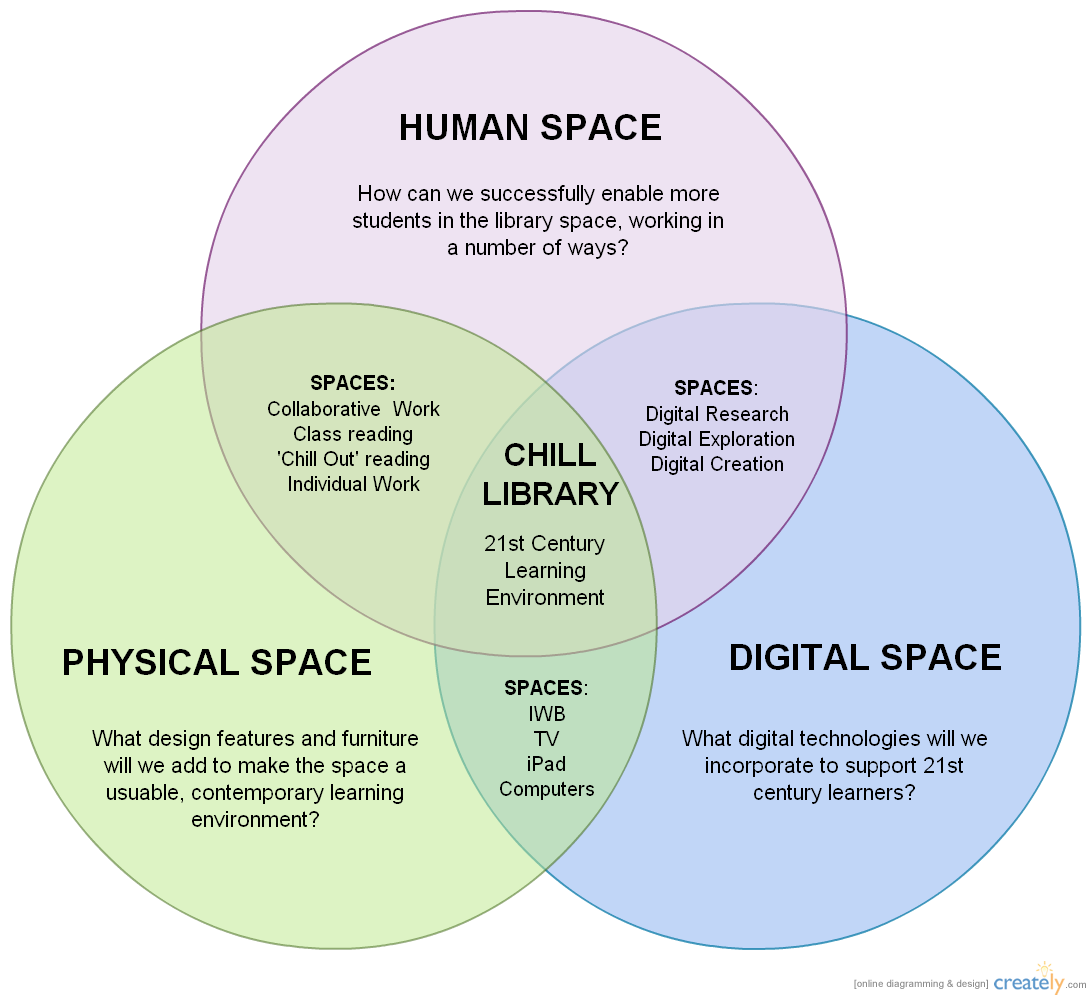
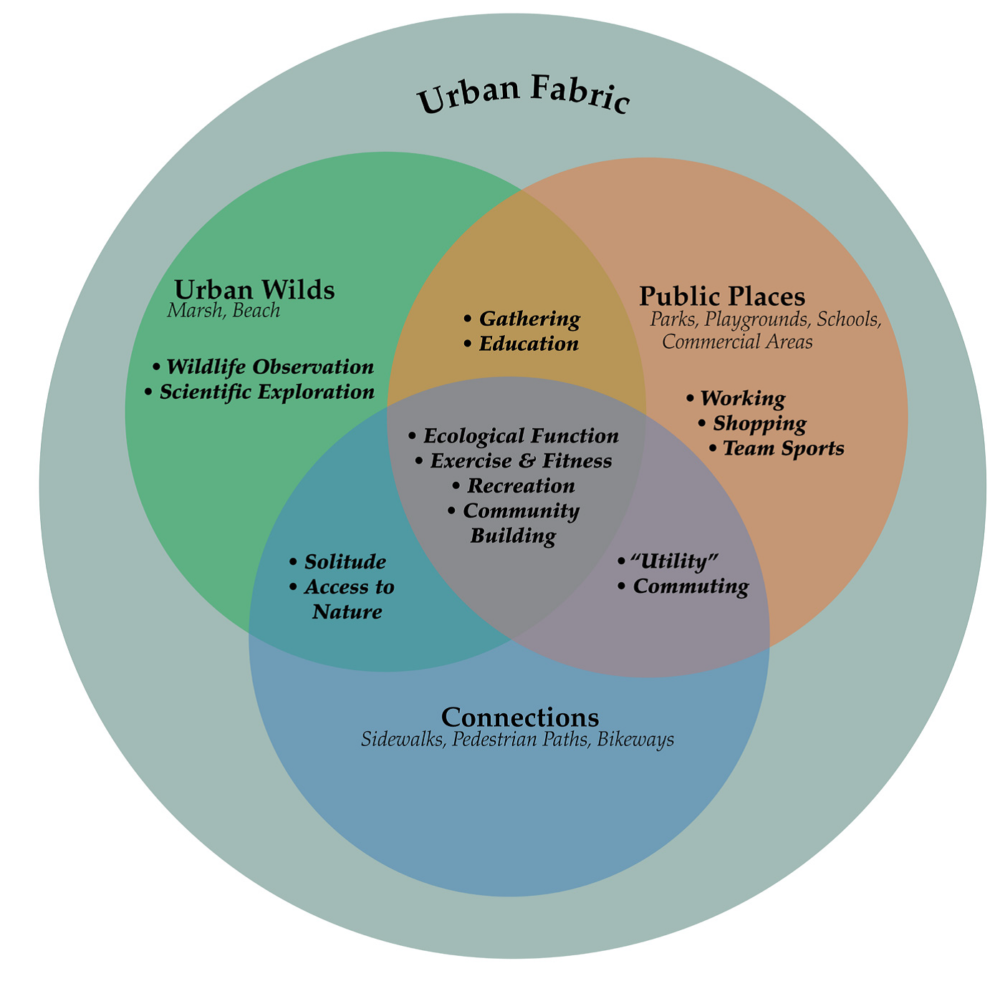
Moreover, Venn diagrams find applications in other fields as well. In biology, they can be utilized to classify organisms based on their characteristics or genetic makeup. In business and marketing, these diagrams aid in market segmentation, identifying target audiences, and analyzing customer preferences.
To sum up, Venn diagrams serve as an intuitive and versatile tool for visualizing relationships and comparisons. Whether you are a student, researcher, or professional, leveraging Venn diagrams can enhance your understanding and analysis of complex data sets, making it easier to draw meaningful conclusions and make informed decisions.